
Up, Down, Left, Right.... Who Knows But Some Hints Were Left For Us...
Thank you all for the amazing feedback on my first sub stack. I do these out of pure enjoyment and as a way for me to track my observations to share with everyone. Like I stated previously, this is completely and NO political views will be shared strictly trade levels and ideas! If you have any charts you will like charted please comment below or on my twitter @RealLifeAxelrod (click to follow)
THIS IS TOO LONG FOR EMAIL AS SUBSTACK WARNS ME… SO OPENIN INTERNET BROWSER -
To get notified of Intra Day Charts and SubStack Articles join my notifications in Telegram Free of course :) I don’t believe in charging for groups. Will be releasing all my indicators I coded and chart layout as many have asked but will do it with conjunction of a tutorial on how to use Volume Profile once we hit 250 subscribers we hit 76 in the first day! -Join AXELORD Telegram for notifications
So to wrap up Friday /ES had a sharp sell off to 4062 which is very interesting and I will share later why as to why I was not too surprised. We have some amazing charts to share that worked out PERFECTLY as planned so grab a glass of wine on this Friday Night and enjoy this post!
KEY TERMS THAT WILL BE USED IN THIS ARTICLE:
- POC - Point of Control
- PD - Previous Day
- PW - Previous Week
- VH - Value High
- VL - Value Low
LIS - Line In The Sand
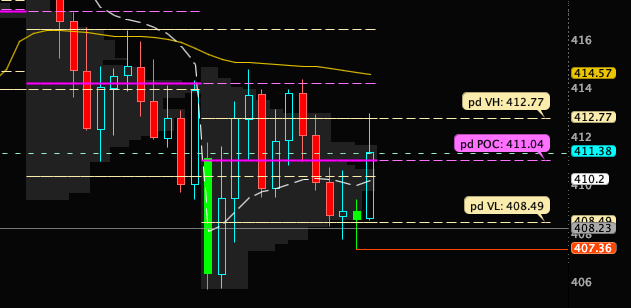
*IMPORTANT NOTE* - For all chart levels that say PD POC VL VH for the lines custom indicator are today’s levels extended since we are after 4pm close as they re-plot every day after 4pm EST.
Except for /ES & /NQ
The following stocks that I will cover are: ES same as (SPY) /VIX / QQQ / NQ / AAPL / MSFT / AMD / NVDA / TSLA / AMZN (these are the main stocks I will post levels for in every sub stack!)
****YOU CAN SCROLL THROUGH TO A SPECIFIC STOCK TO READ THOSE LEVELS.****
🐦 BIRD’S EYE VIEW - mixed emotions all over the place
2 Patterns Across The Board Today!
- Rising Wedge - Was seen on almost every chart today across the board and then followed by…
- Falling Wedge - You guessed it right!
These are 2 VERY common patterns and here are examples from google. Charts posted below so you will see :)
YOUTUBE Links posted to watch about these patterns more otherwise scroll below to get into our stock digest!


Stocks We Will Be Reviewing
- Top: SPY / ES / VIX - Bottom: QQQ / NQ / UVXY
Top: AAPL / MSFT / TSLA - Bottom: AMD / NVDA / AMZN
The Breakdown
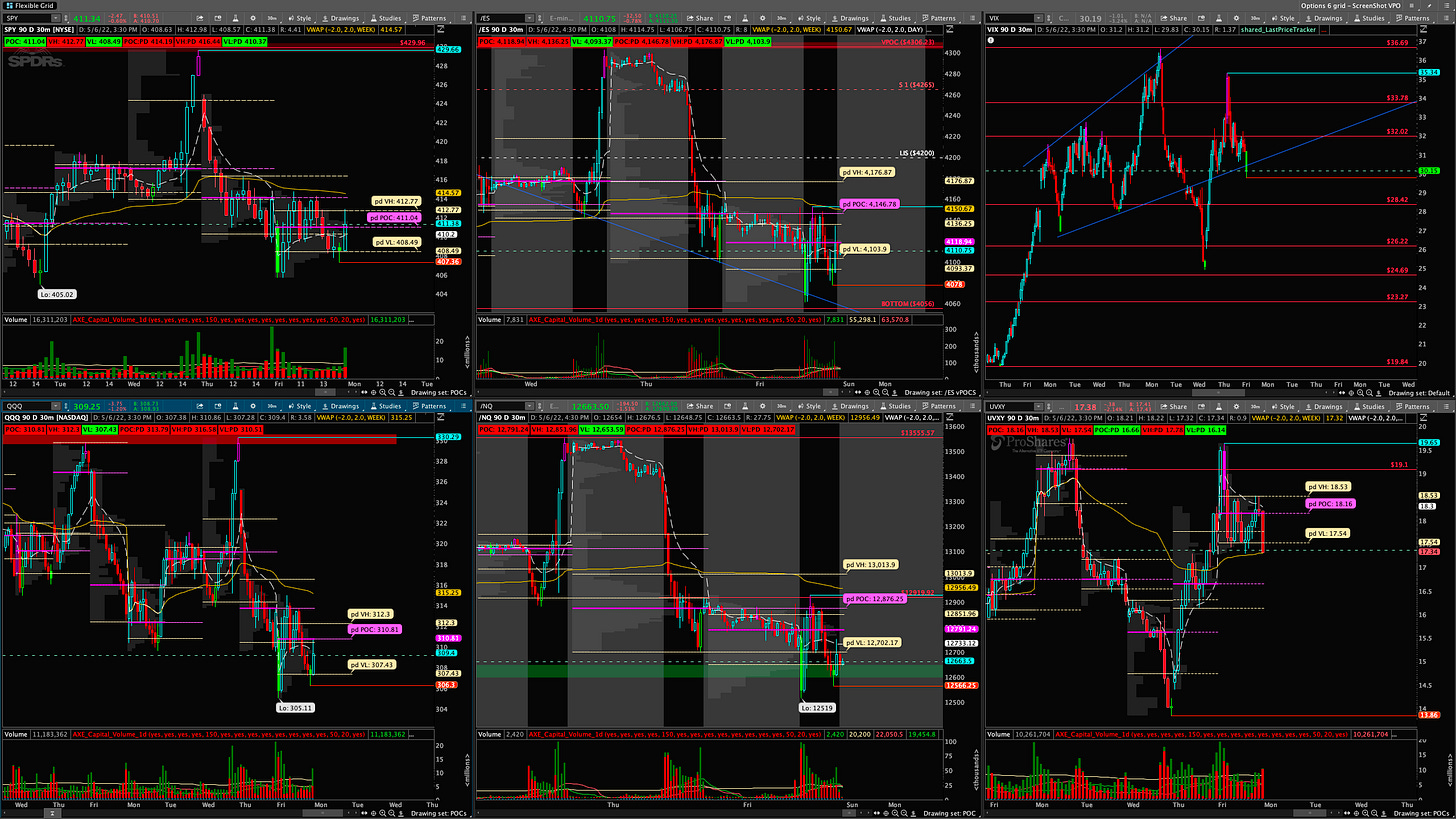
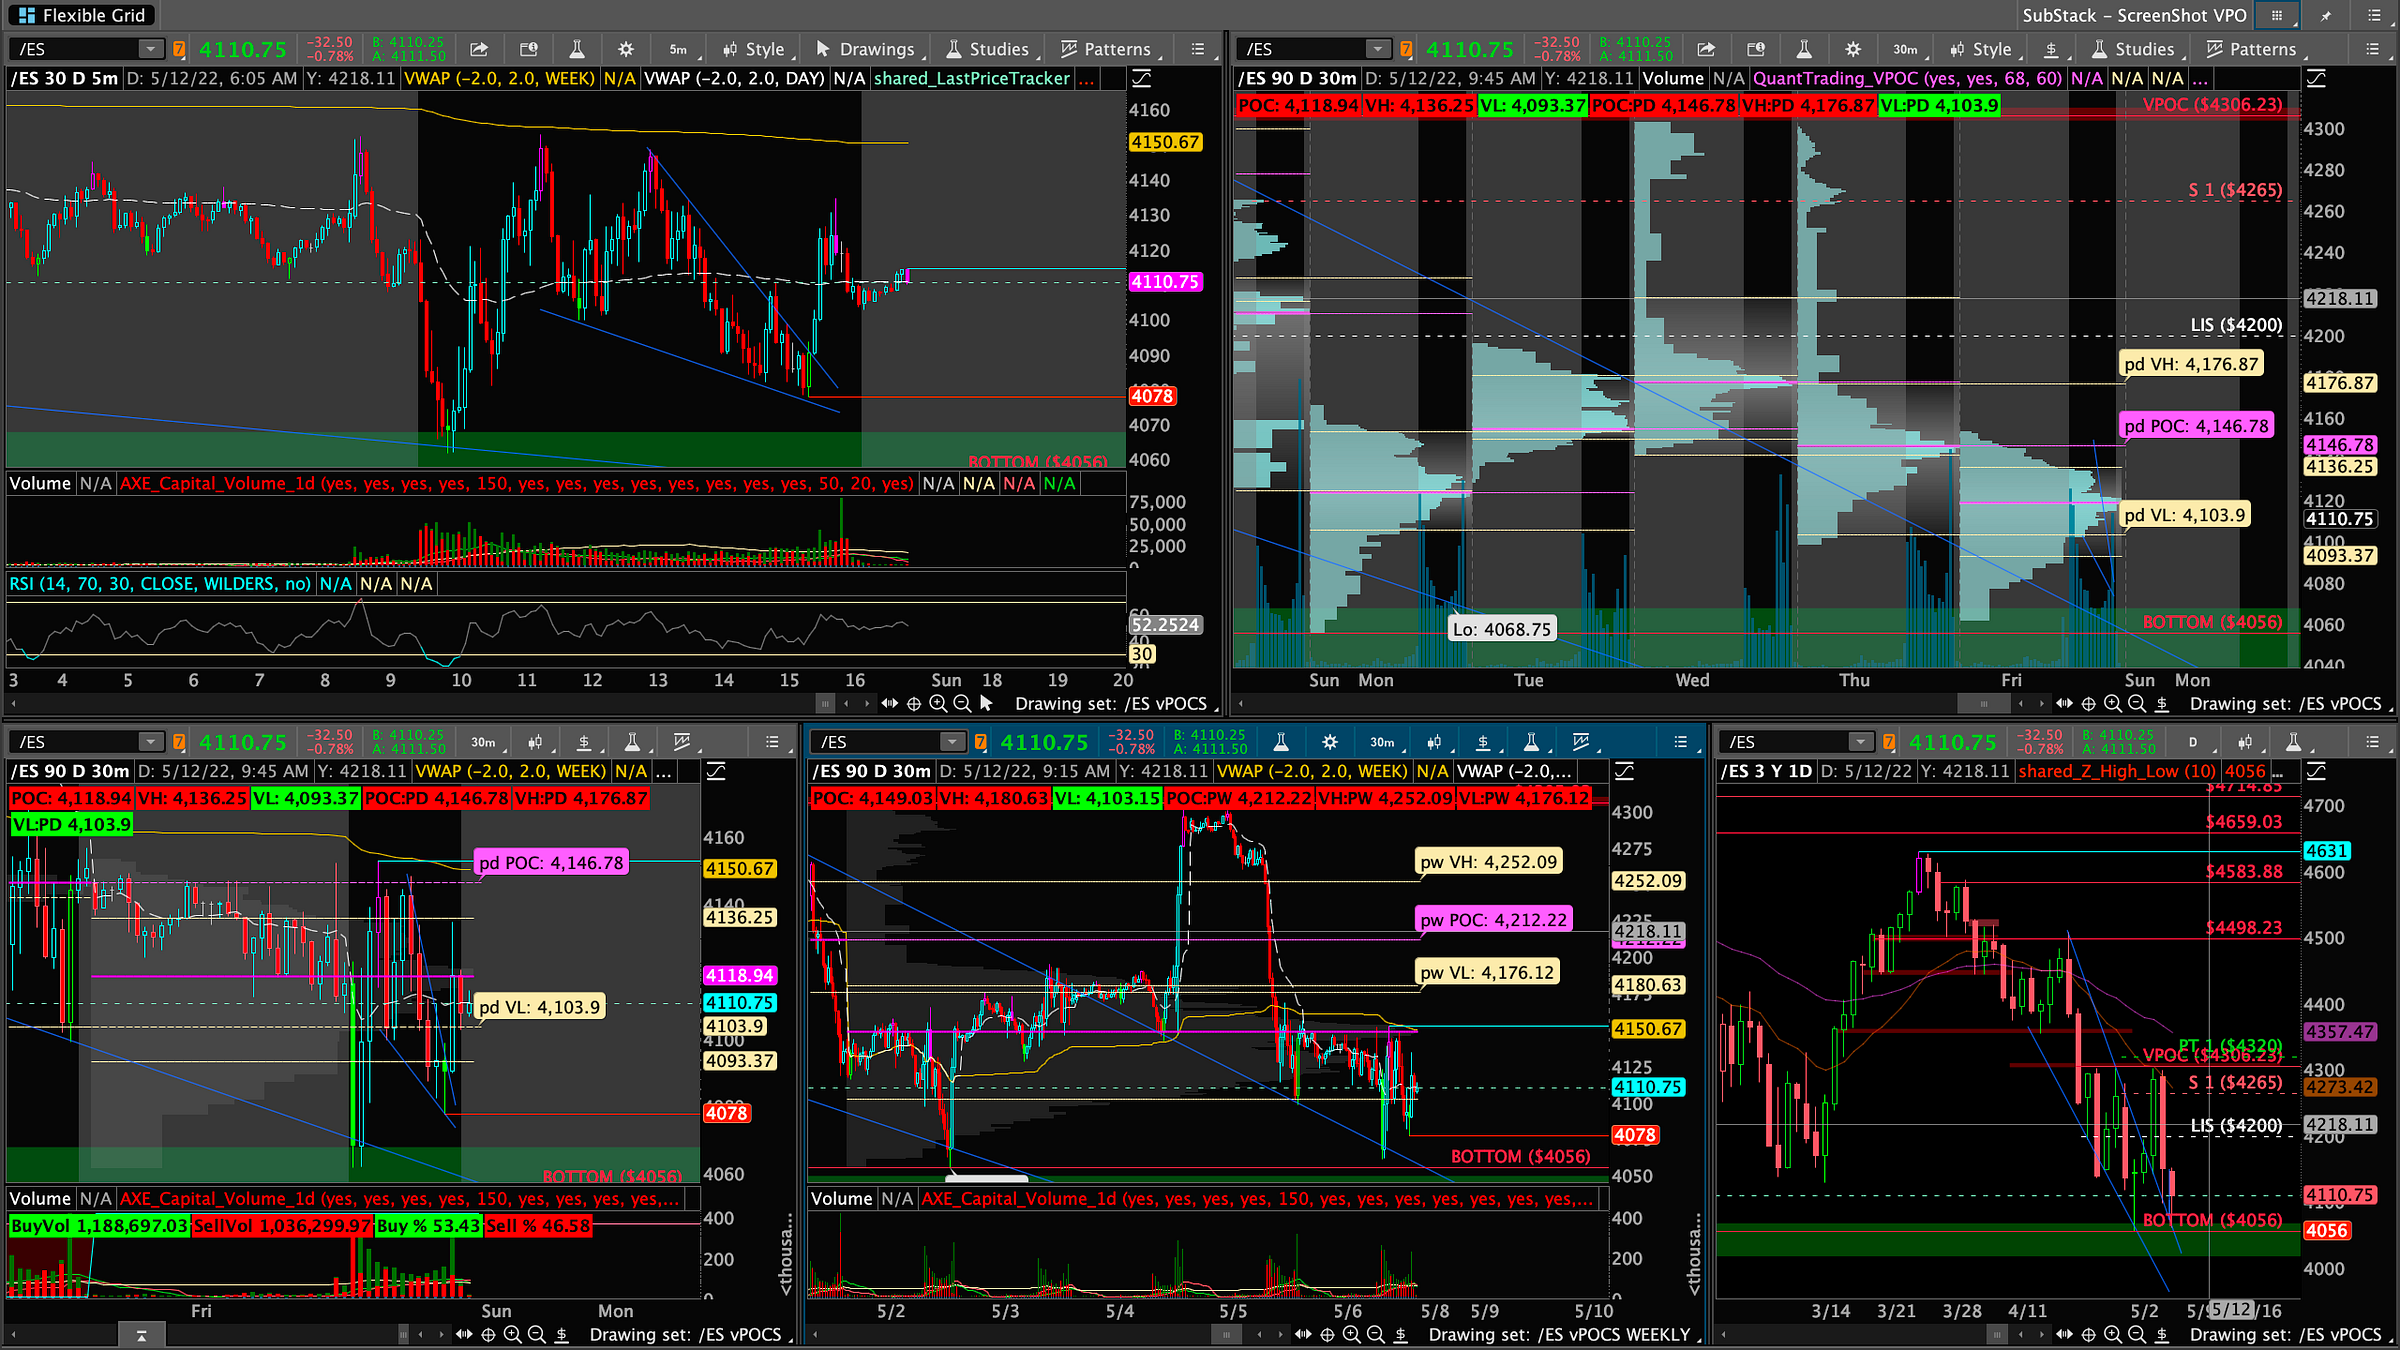
/ES (same as SPY)
Morning session we opened right below daily VWAP (white dashed line) and weekly VWAP (yellow solid line) as well as POC which was 4,118.94 so open below POC from yesterdays plan was in play. Came down 50 handles to my green buy zone of 4050 range and on the outside of my trend line which looks to be a massive falling wedge. (technical pattern - google examples to learn what the pattern looks like)
Notes on The Whacky Close: Based on the close I noticed another pattern and took calls right before close as each time they dragged it down they were yet to fully bid whack it back to 4050 level and pulled it up very fast.(If you watched DOM - depth of market you would have noticed this) 4080 level provided key support zone for the rip of 50 handles up. It wasn’t the strongest close tho however, I do see a relief bounce possibly Monday back above 4100 level to 4120/41500 to test that key weekly VPOC.
Monday Game Plan:
- OPEN Above POC - 4,118.94 - We will need to see a strong move after hours or Sunday night/Monday pre-market if we are to open above it. If so levels to watch are: 4150 weekly VPOC which is also Weekly VWAP. Above that 4180 weekly VH and then 4200 2 weeks ago weekly VPOC.
- Currently LIS is 4200 however 4150 seems to be a very hard for us to crack and stay above which is the weekly POC level.
- OPEN Below POC - 4,118.93 - Will be careful to do puts as bears are and bulls are getting exhausted so will see how the IB Session is. (Initial Balance - first 60 minutes). If we show overall weakness I will look for that 4050 zone to hold and ultimately retest the low of last week 4056.
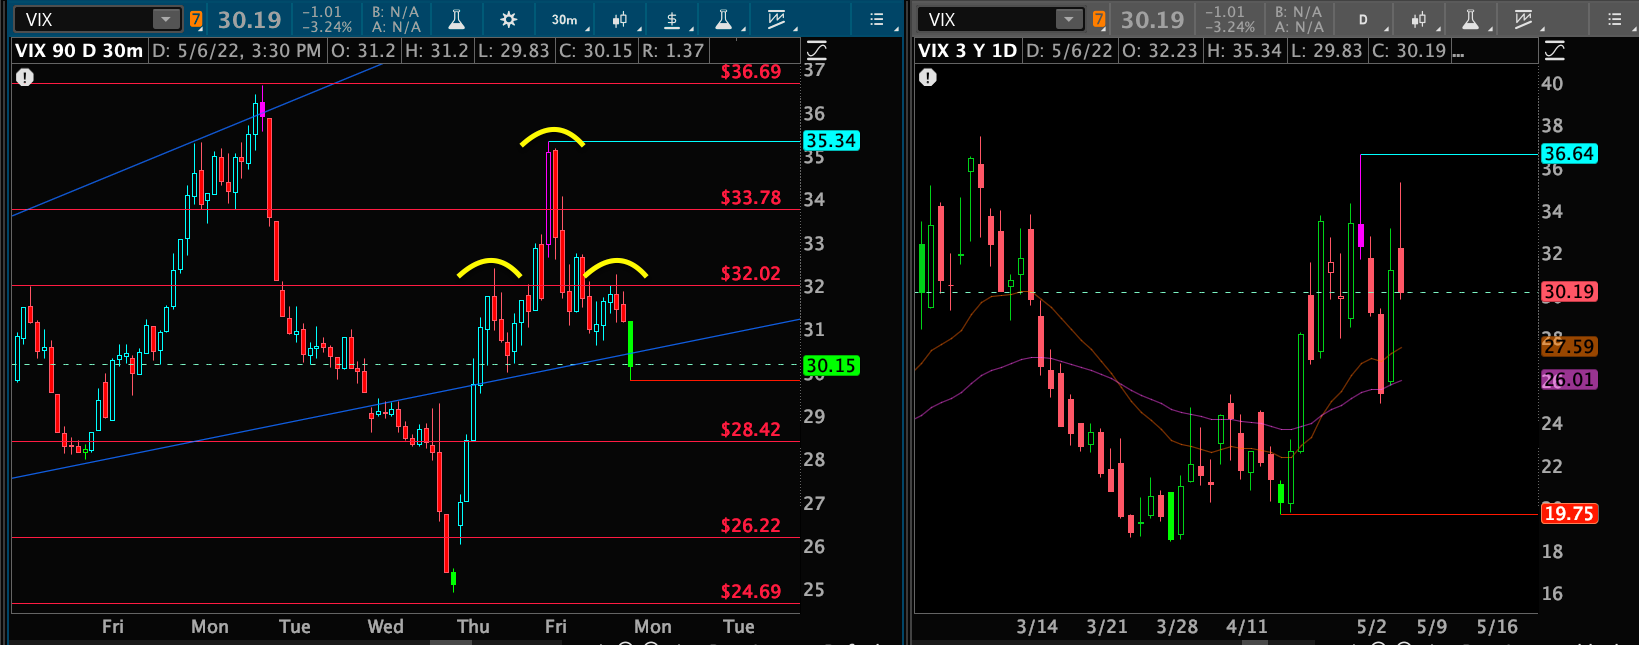
VIX
Classic Head & Shoulder Pattern played out as we formed the head today and right shoulder into close. Would like to see it catch up with the 20ema and come down to the 28.40 zone and see if we can hold there.
Monday Game Plan:
- 35.34 Level - was HOD today and will be the first level to break through and go for the 36.69 retest which is prior resistance.
- Same game plan as Friday. If it decides to pull back first level will be 29.98 level and then 28.42 > 26.22

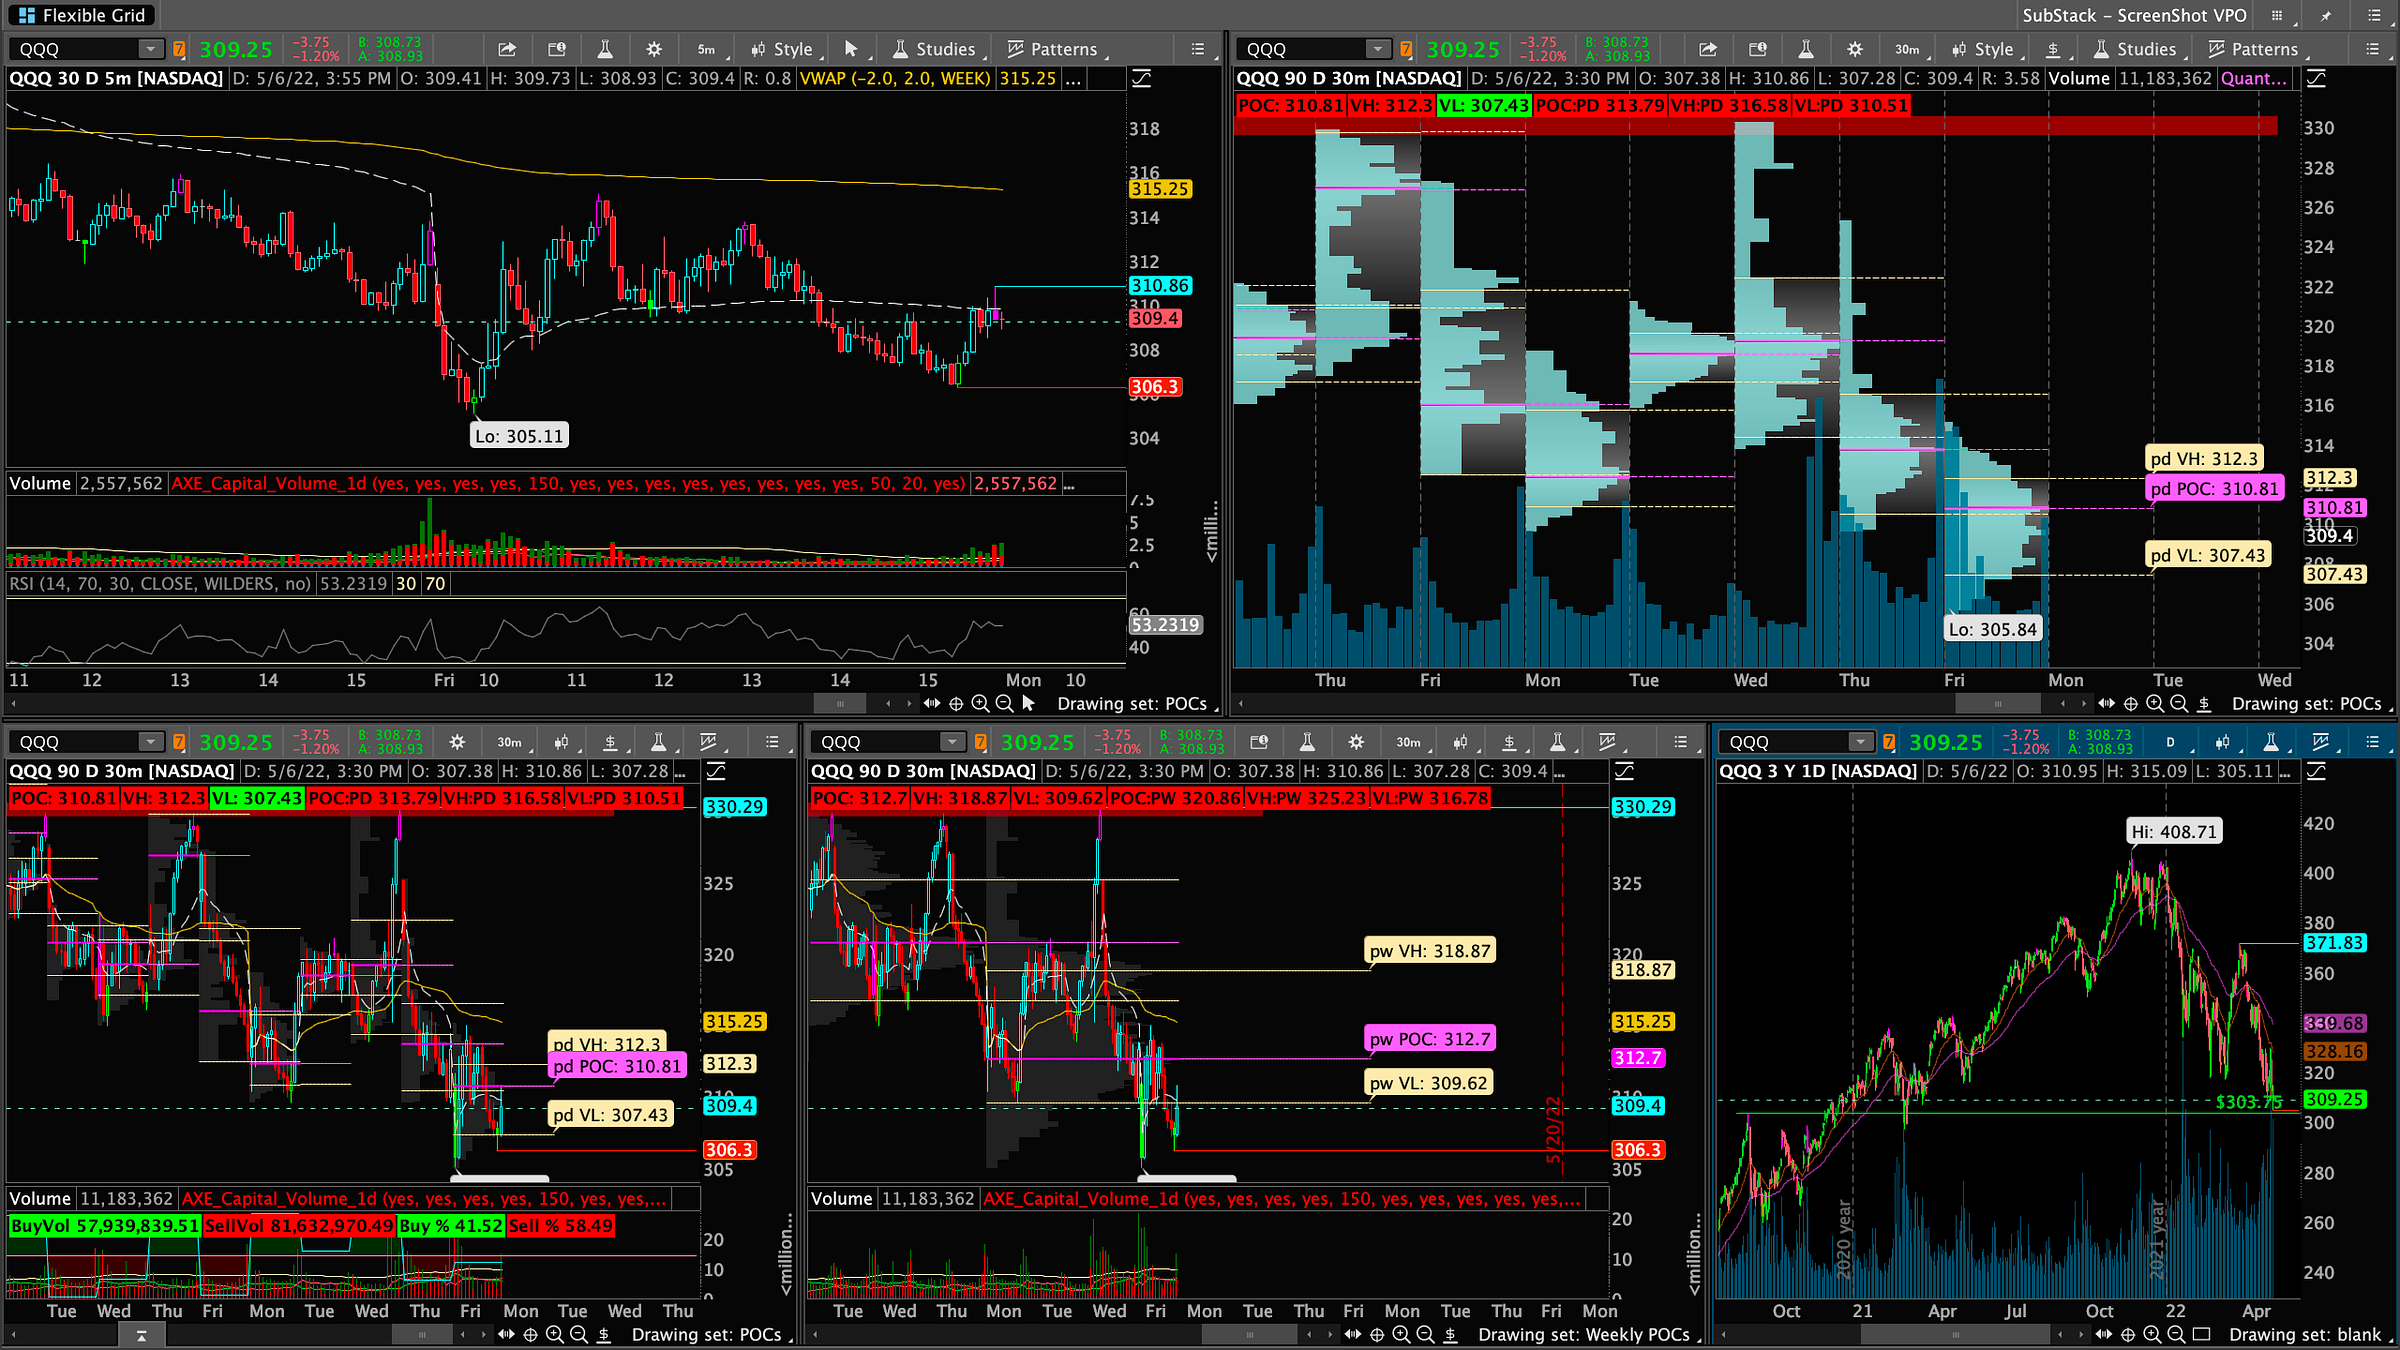
QQQ
Followed the same pattern as ES however, it made a new weekly LOW which was ugly however if as a major volume shelf here at 303/305 zone (see daily chart).
Close was week below daily VWAP and below POC 310.81
Monday Game Plan:
- OPEN Above POC - 310.81 - May be hard to open above it unless futures rip. Some levels if we get above it Monday are as follows: once we clear 310.81> we test 312.70 zone which is weekly POC and happen to rip can retest 320 zone eventually would be a relief bounce.
- OPEN Below POC - 310.81 - This is where things get ugly… We have a major level in the 303/305 zone that must hold otherwise there could be more downside to 297 Level. Below that not much hope till 282/285.
If you notice on the Bottom right of the picture we have the daily chart and looks to double bottom wicked off 309 level as it was 309.65 the previous low 3 sessions ago.
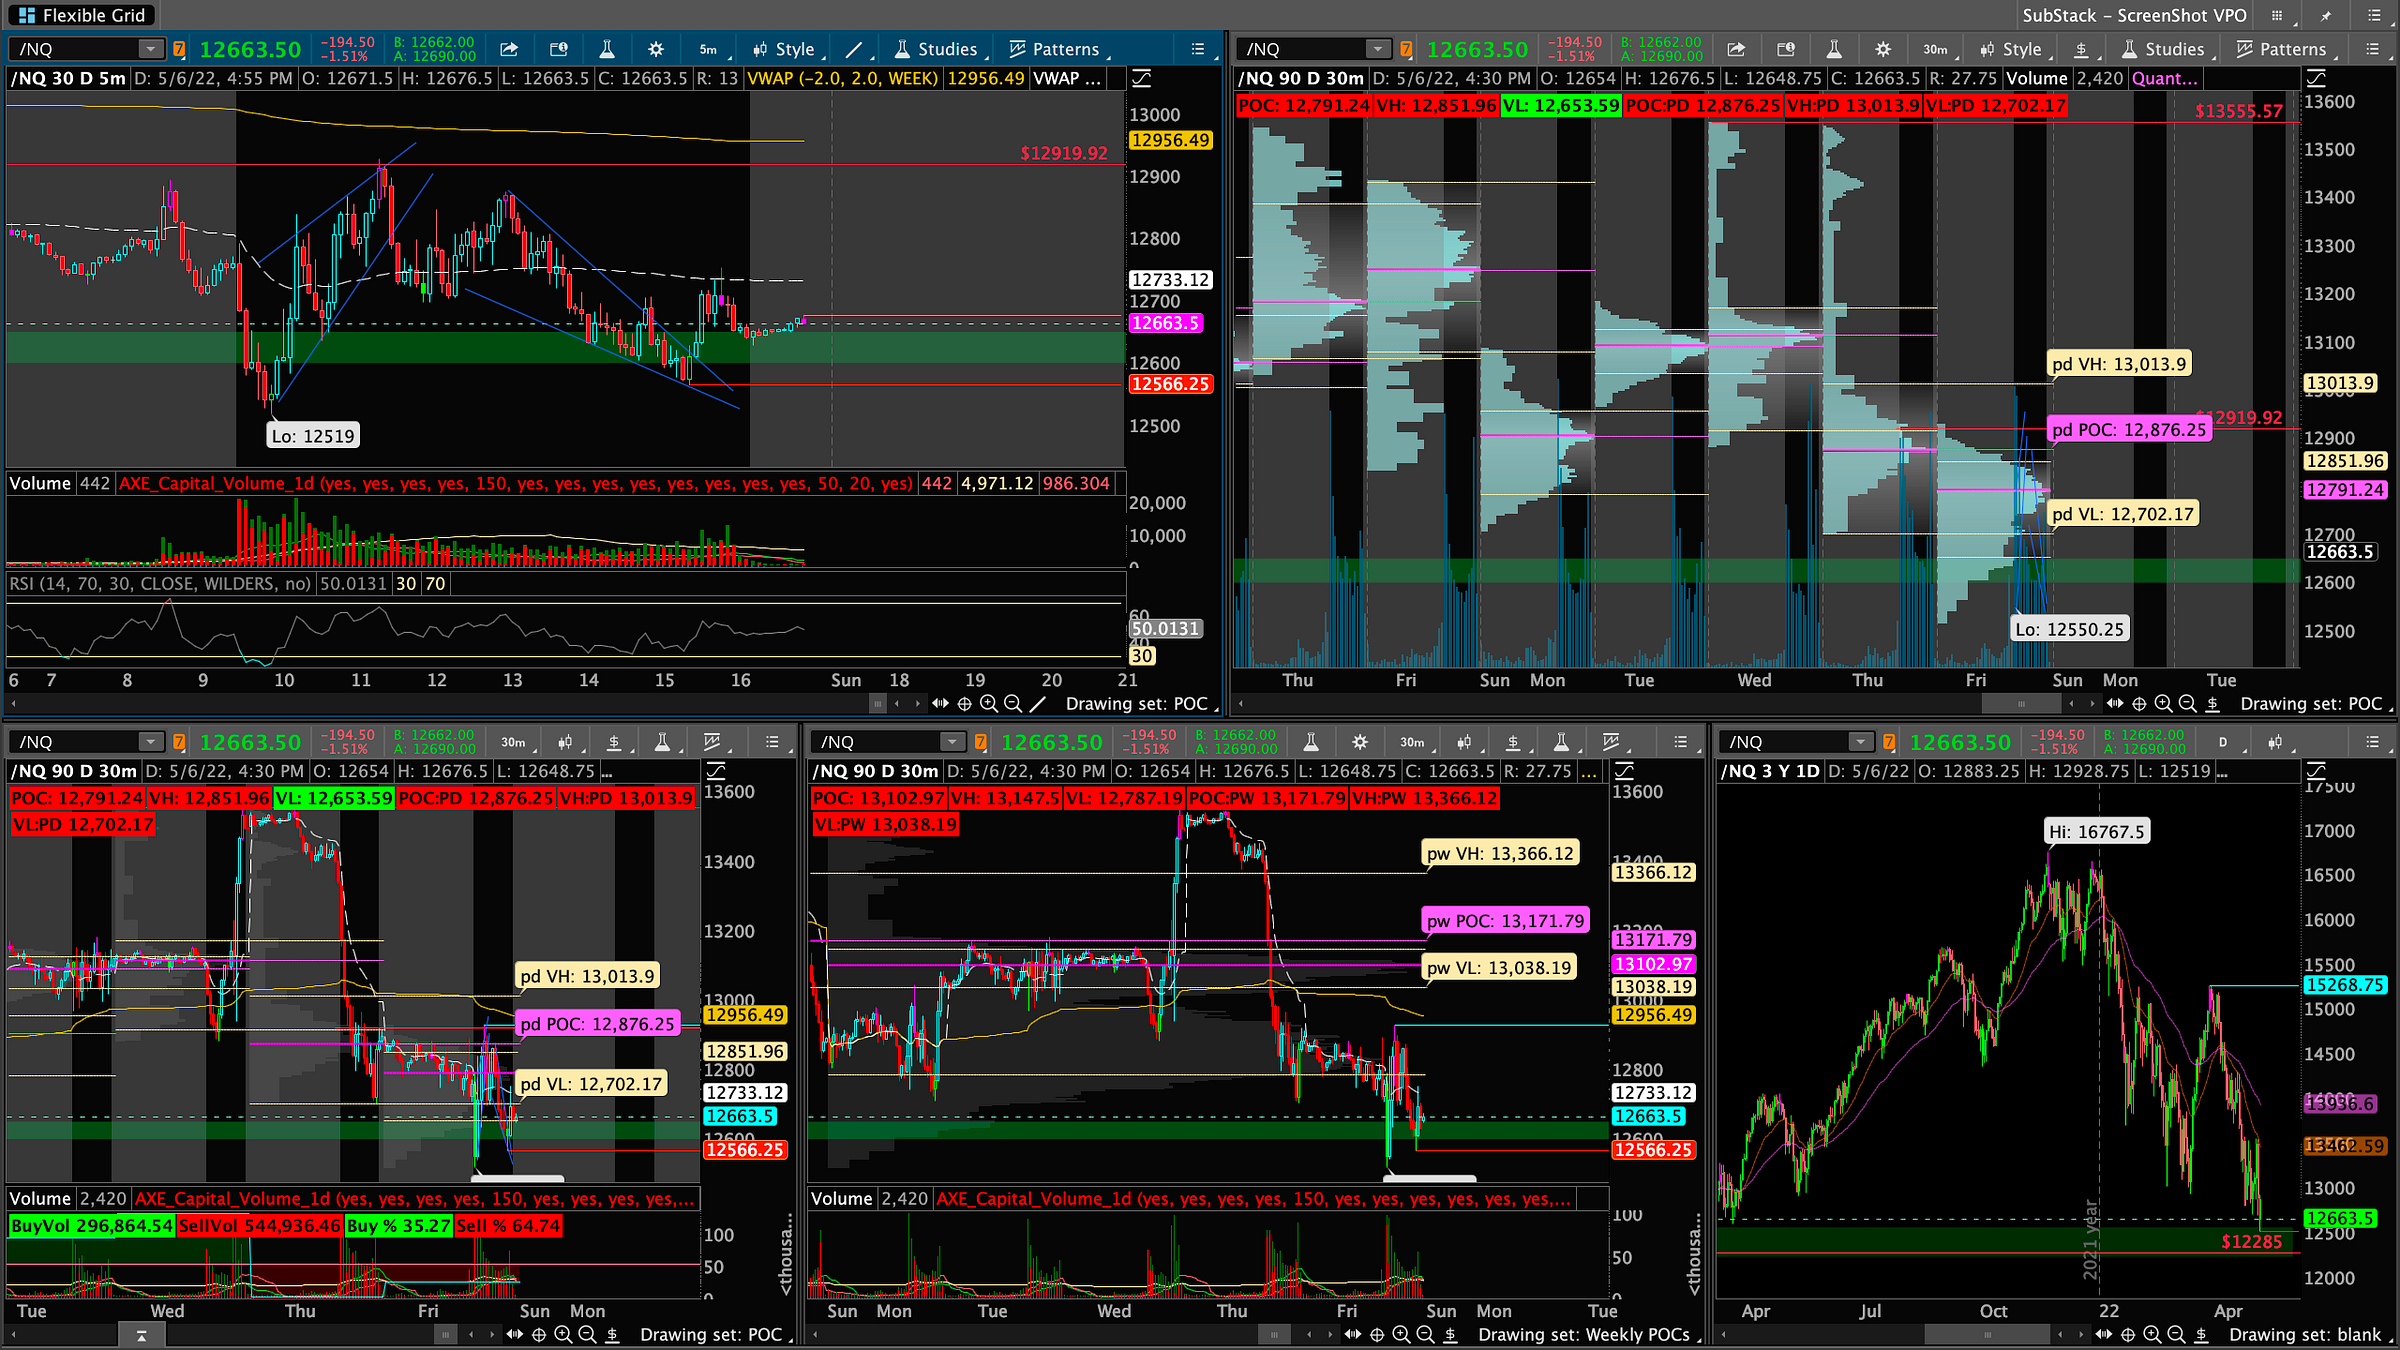
/NQ
Another nasty day same patterns across the board rising wedge follow by a falling wedge. Weak close below daily VWAP and slightly aboveVL (Value Area Low). We manage to have a range on the daily chart here between 12,250 - 12,600 where we wick around some daily candles and could potential chop and base around… hopefully for upside potential sooner or later :)
Monday Game Plan:
- OPEN Above POC - 12,791 - We grind our way back up to POC 12,791 and weekly VL 12,787 which is close to that the 12,800 range (psych level). If we can regain those values and come back up to 13,000 / 13,100 which is weekly POC level and close above and push higher there will be some relief.
- OPEN Below POC - 12,791 - we will be going back down to test 12,519 low from Friday and work our way to that 12,600 level
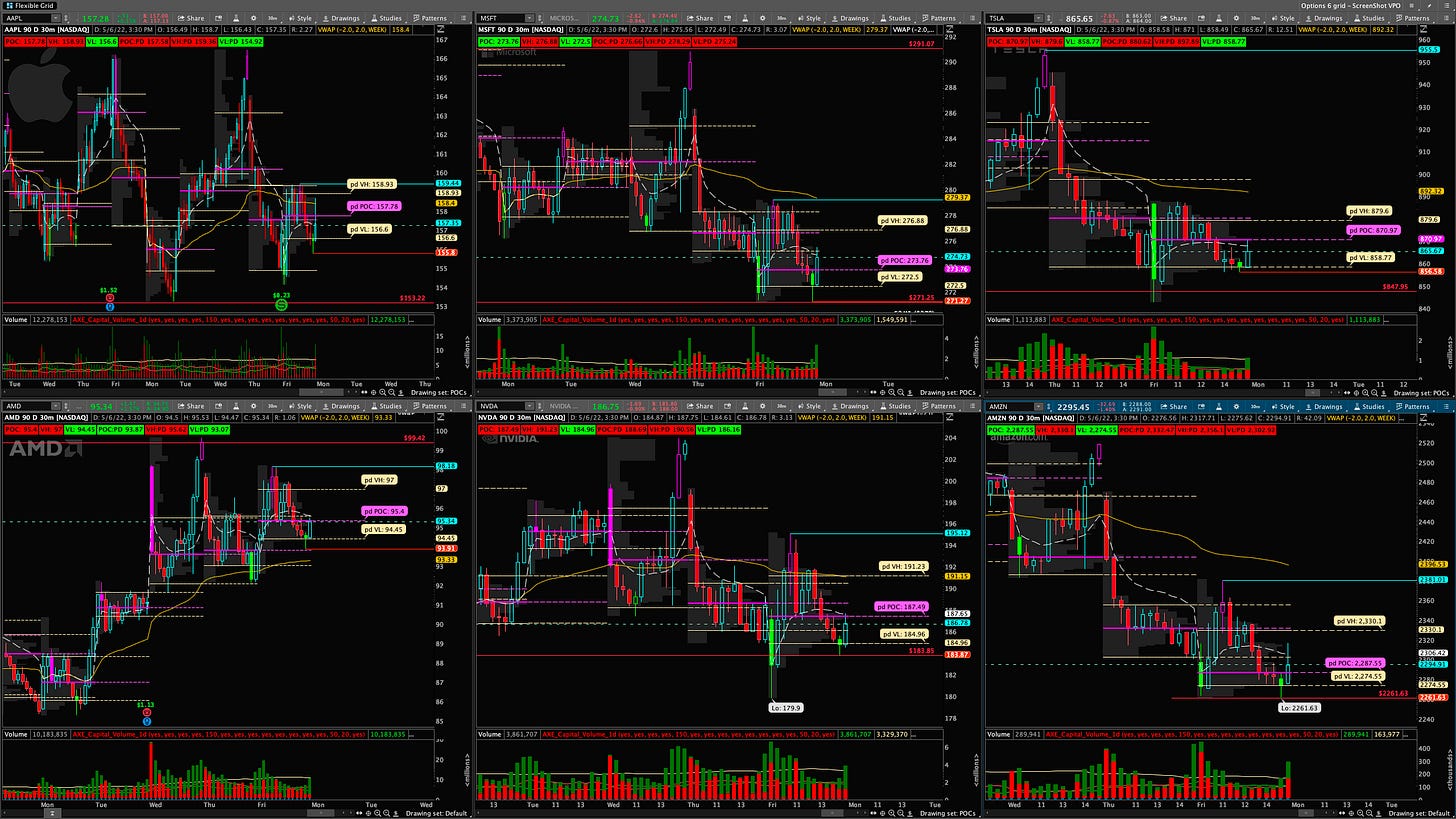
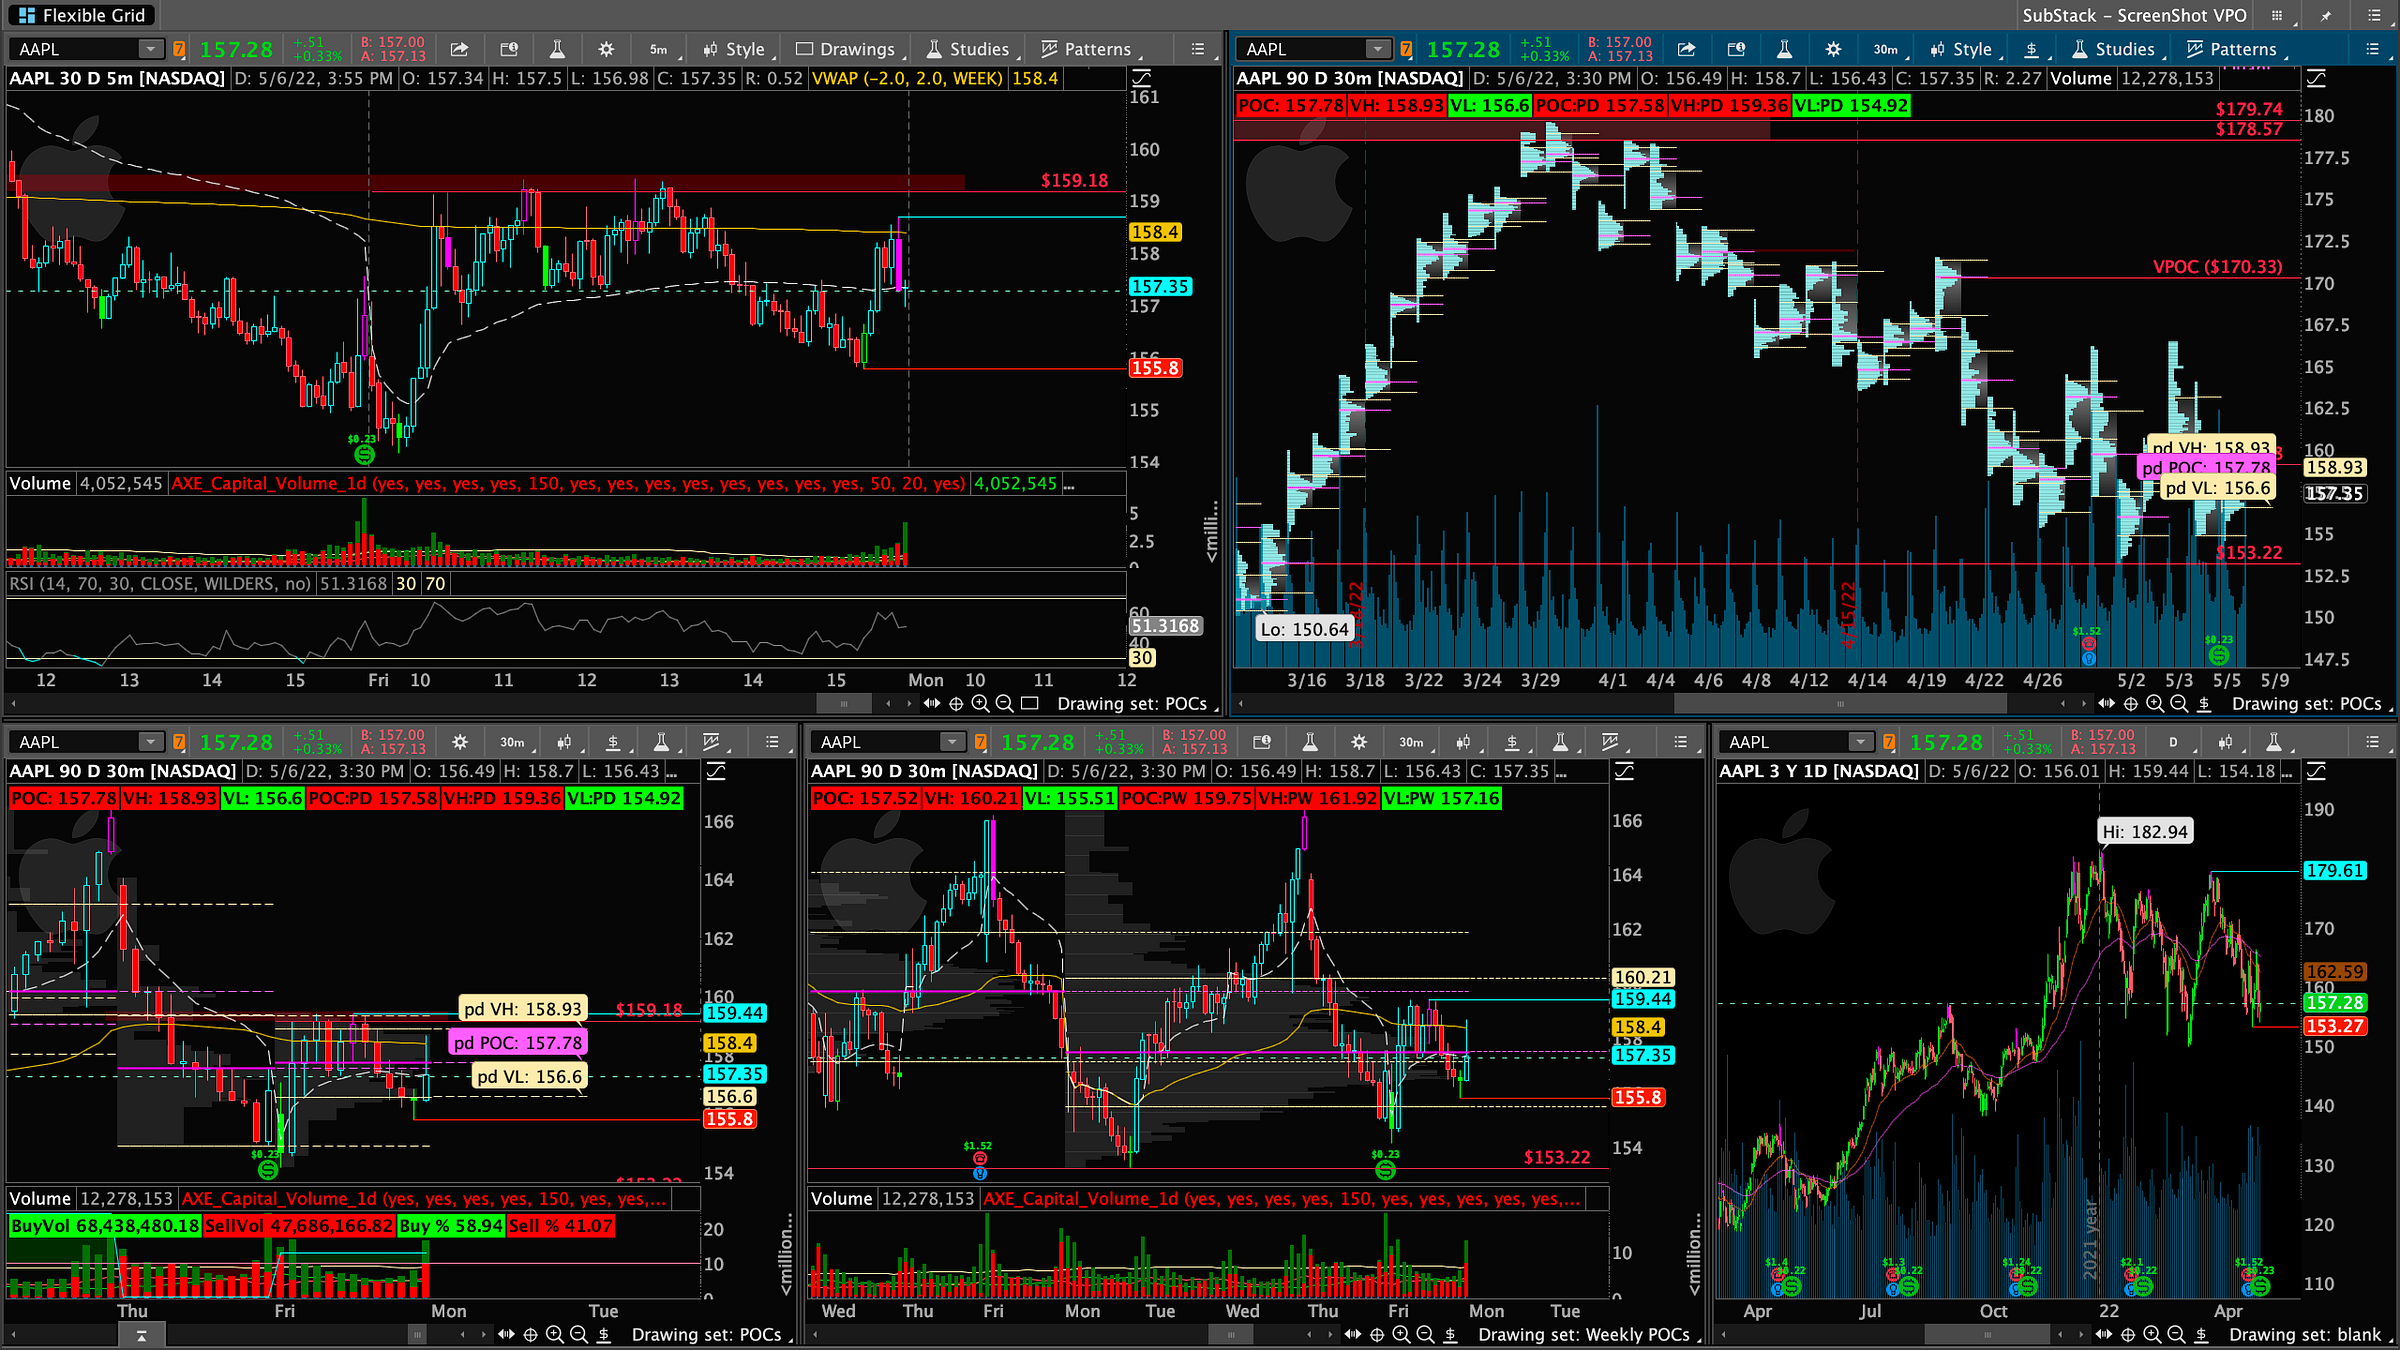
AAPL
Let’s See if you can spot where the resistance today was by looking at my chart analyzing where the PD (previous day) POC VL VH are…. well if you guess PD VH you are correct. Previous day Value High 159.36 was where we ran into issues. You could almost call it a triple top pattern. It is also the PREVIOUS weekly POC 159.75 zone.
- Closed below Weekly VWAP but above Daily VWAP and would like to see it regain that weekly vwap early into next week for a change of market direction.
Monday Game Plan:
- OPEN Above POC - 157.78 > only .20 cents higher than previous day POC so these range is kinda tight for aapl. Over 157.78 we retest that we could revisit VH 159.36 which would bring us back over the weekly POC which would be nice to hold into close on Friday as AAPL and MSFT seem to be tech leaders in the market.
- OPEN Below POC - 157.78 we slide down to 155 zone for a test and hold and ultimately slide down to 153 zone. We could retest POC and try to break it for a shot for upside continuation. If we reject it we will retest the VL 154.92 then revisit 153.22
KEY LEVEL TO WATCH - 157/153: If you look at the top right chart - this is the volume profile one again seems to be tested and is holding so far. (also the daily chart we have 2 major zones that 157 where we currently sit and 153 that POC. That was a major POC from weeks ago that we bounced off of a few days ago and may bounce off it again. So very key 153.22 level.
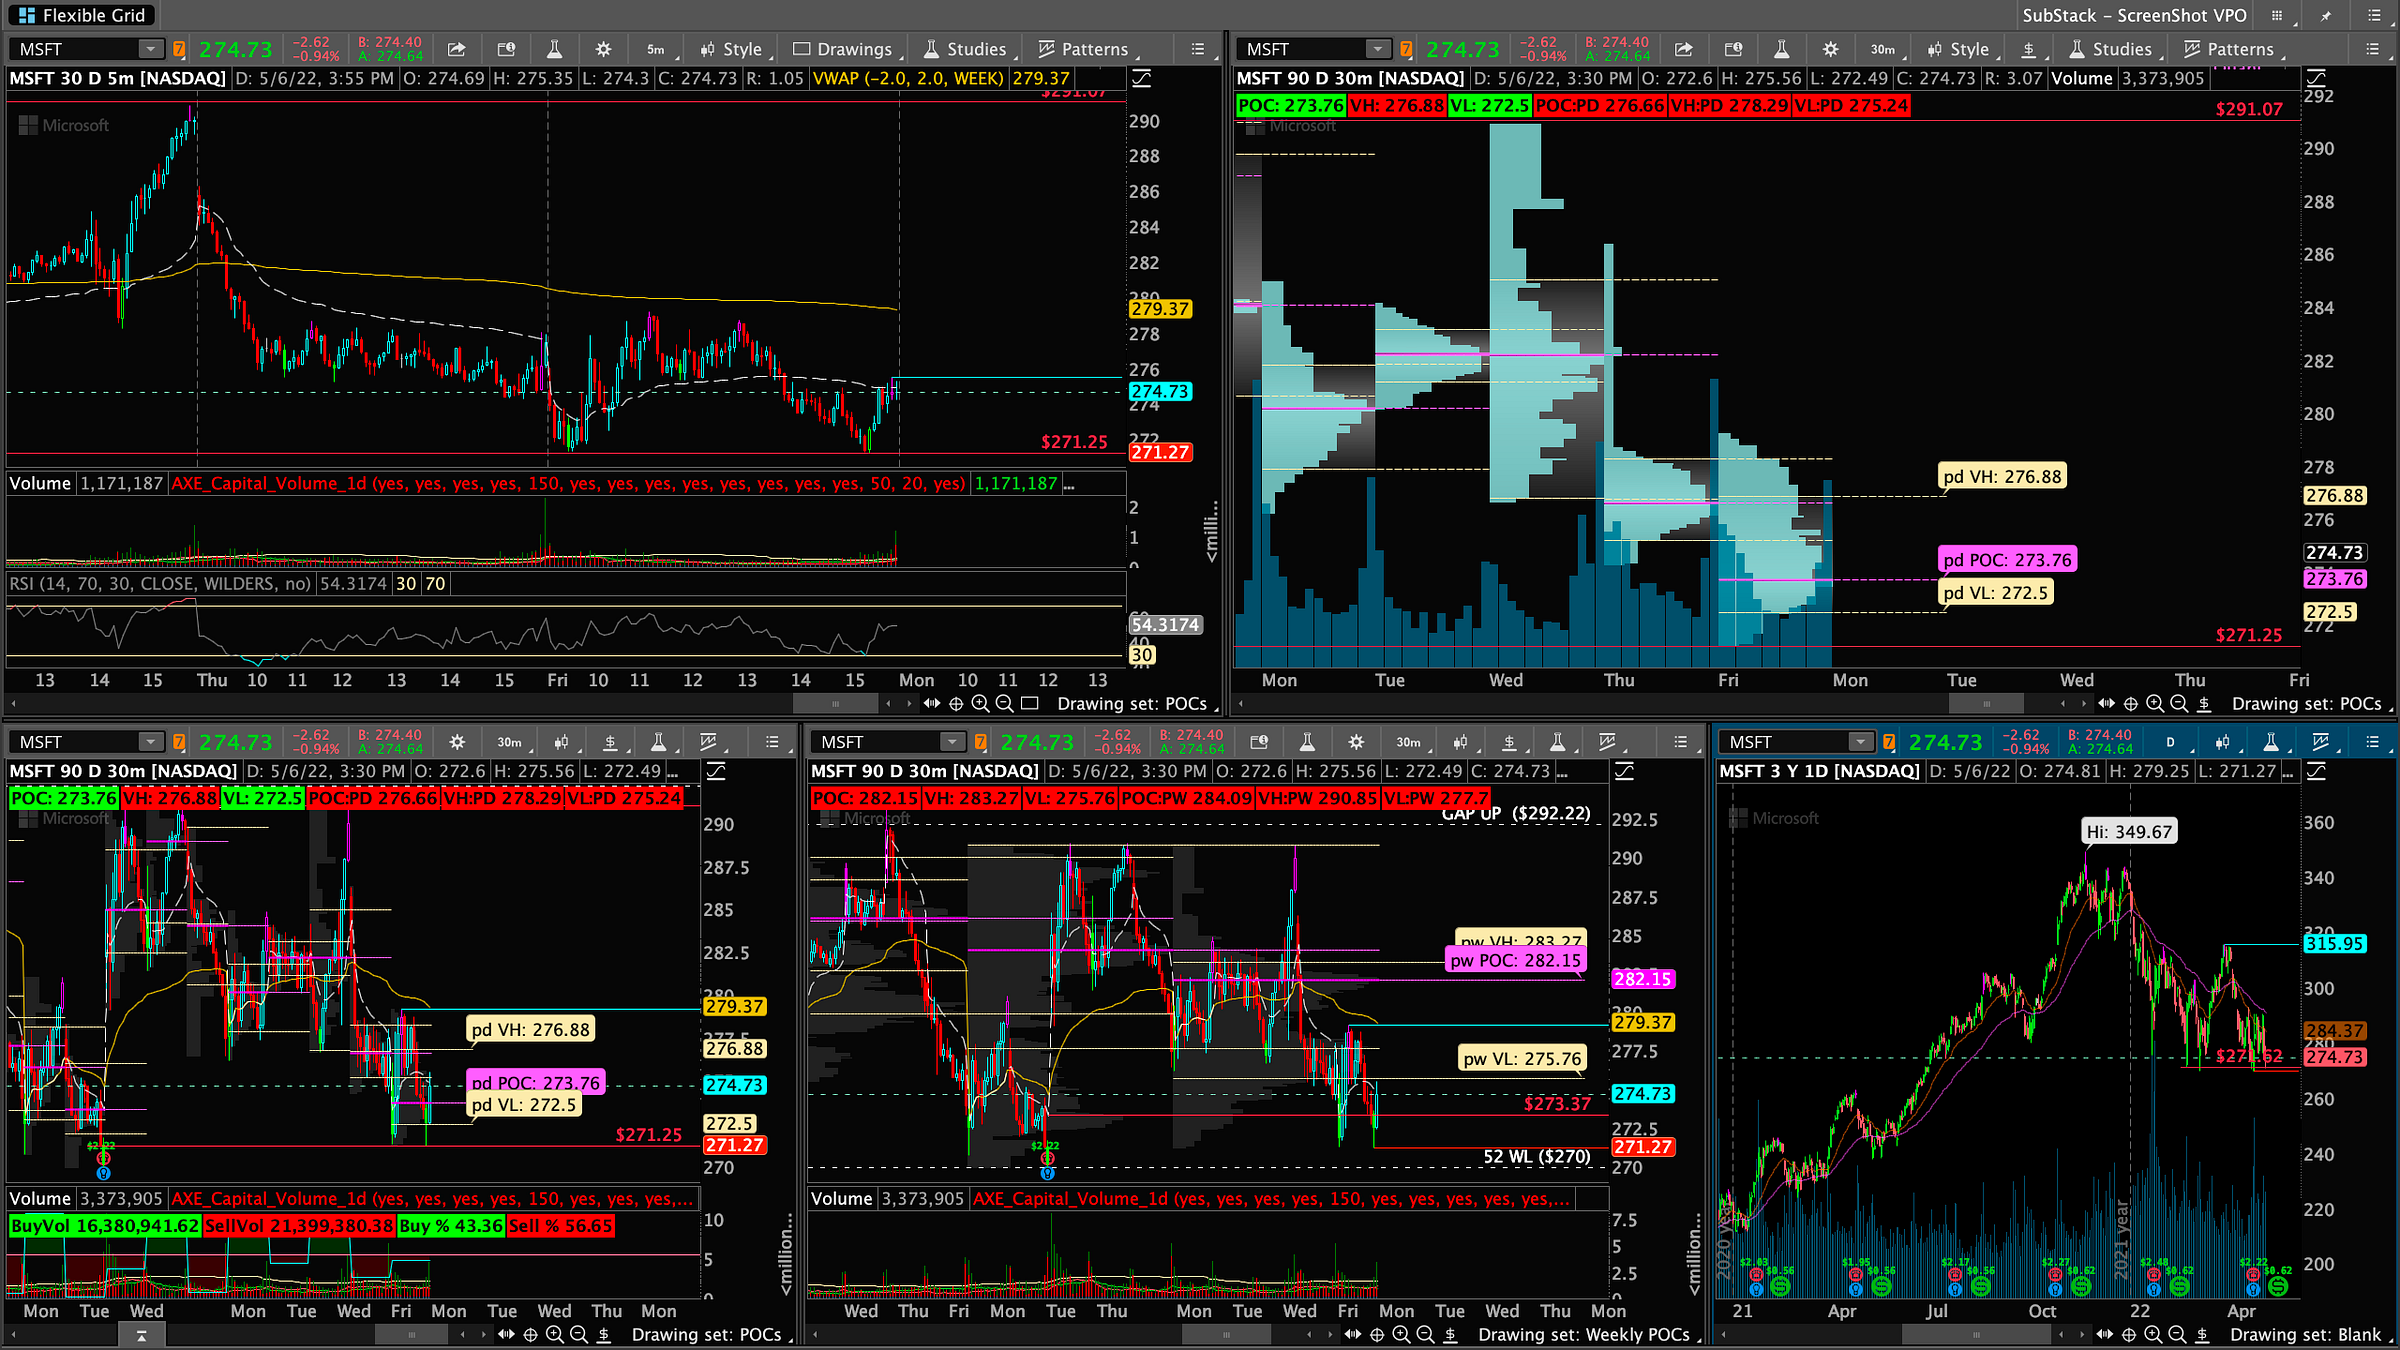
MSFT
271 Magic Zone - Slide down to the magic 271 zone. Look at the daily chart (bottom right) we came right to this zone that has been previously tested and wicked up several times. After we slid down to 271 we bounce up into that rising wedge then falling wedge to bounce right off that 271 zone again. a.k.a. double bottom!🙃
Monday Game Plan:
- OPEN Above POC - 273.76 - With our close on msft above POC would like to hold this level to take a trip back up to 280 however may run into sellers around that 280/282 zone. Through that we can start our grind higher to 290.
- OPEN Below POC - 273.76 - If we manage to drag below POC on Monday pre market we could be heading back to that 271 zone and slide to 270. Below 270 doors open to next support around 260.
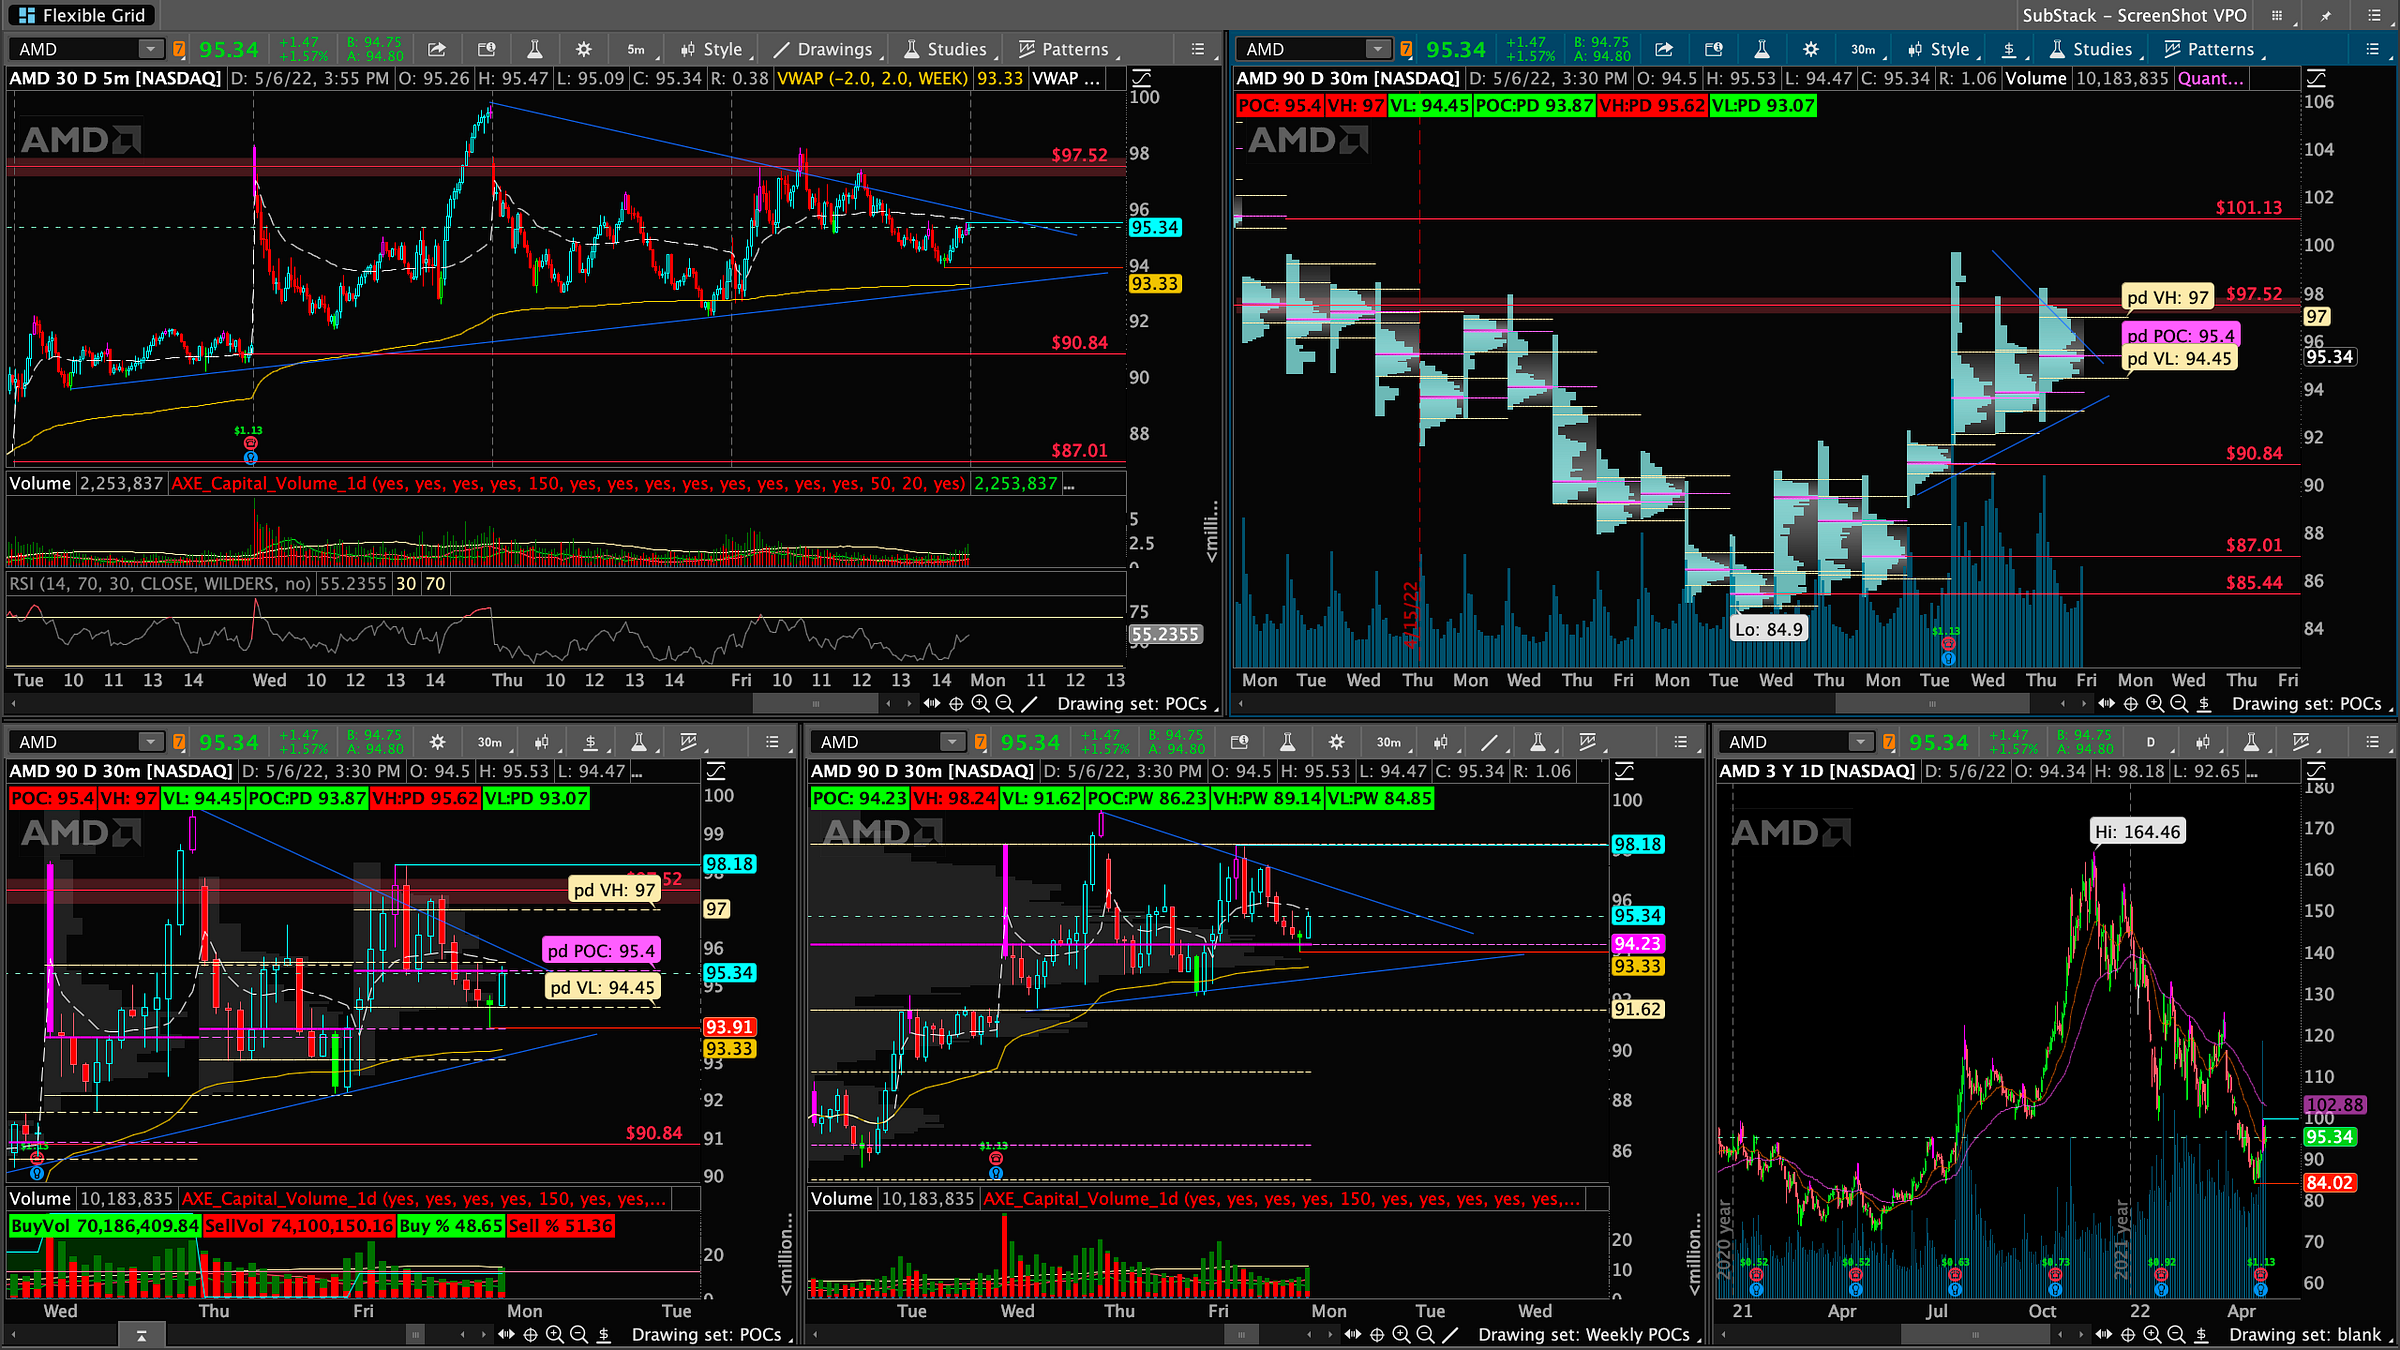
AMD
Wow what a day! This Chart I absolutely LOVE! 😎 This is a picture perfect example of how POC level/volume nodes with levels work to a T perfectly sometimes! So let’s break this down!🧐 As stated in Thursdays night plan if we open above POC we could see a retest of VH at 96 area. Let’s look at the top right pic in chart which I will make even bigger so you can follow along! (scroll below for notes)
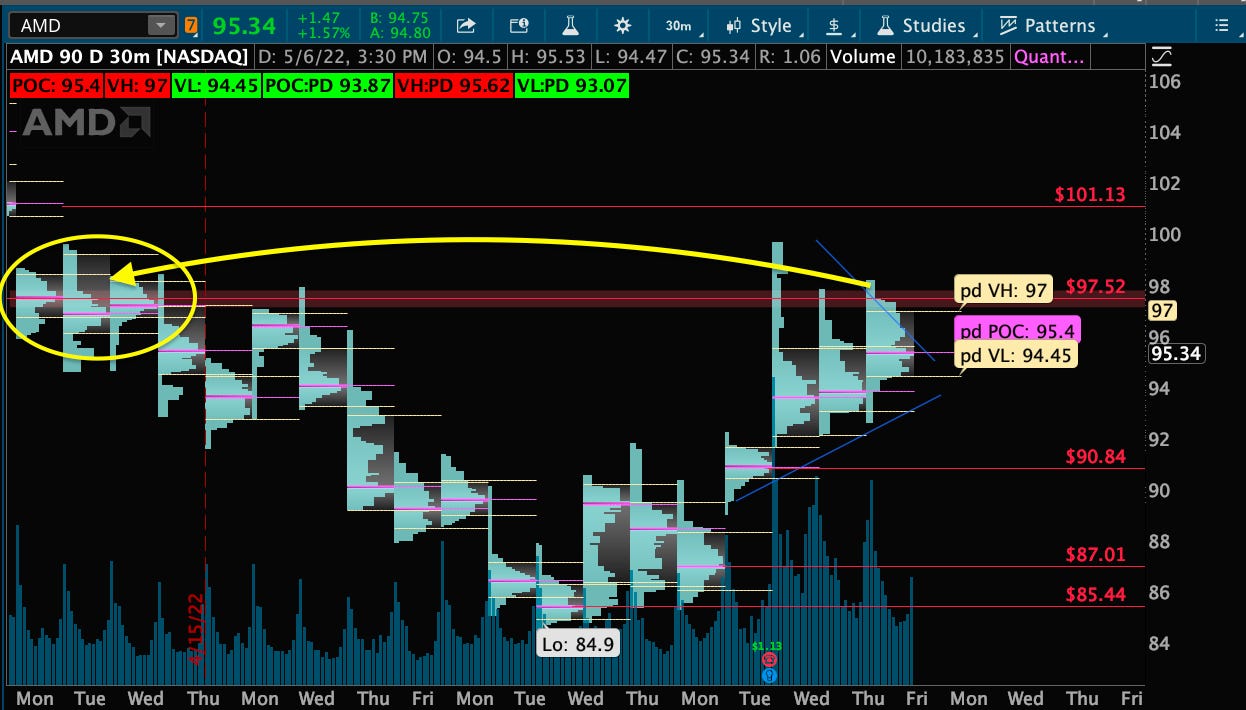
- We have a key zone of 101.13 a naked/virgin POC they call it a.k.a V POC which we didn’t get to yet but slowly grinding back up to.
- But let’s analyze this volume zone at 97/98 area from a few weeks ago we had 3 days in a row that the POC was around that zone with some big volume nodes (side ways blue bars = volume nodes) so sometimes you can leave your levels on a chart once tested or remove them. I noticed this morning as AMD gaped up we were grinding higher and this level could become trouble which it did.
- Resistance often can become a magnet for price and in this case it is as with AMD great earnings too it’s not going to give up as easy as other stocks and she’s a fighter!
- Opened above PD POC - despite the dip ripped right up to that 97 zone then bounced right off yesterdays POC 93.91 near end of day (see bottom left picture below)
Monday Game Plan:
- OPEN Above POC - 95.4 - we closed right below POC .06 cents lower…tragic lol. However, if we gap up Monday pre-market and if the whole market decides to rip up on a relief bounce we could see AMD break out of this flag pattern and rip to 100/101 level.
- OPEN Below POC - 95.4 - first test would be 93.91 area (slightly below 93 is trend line) below that we can grind down to 91 zone which is the Weekly VL. Through that 90.84 we have a VPOC yet to be tested as support. (see top right pic)
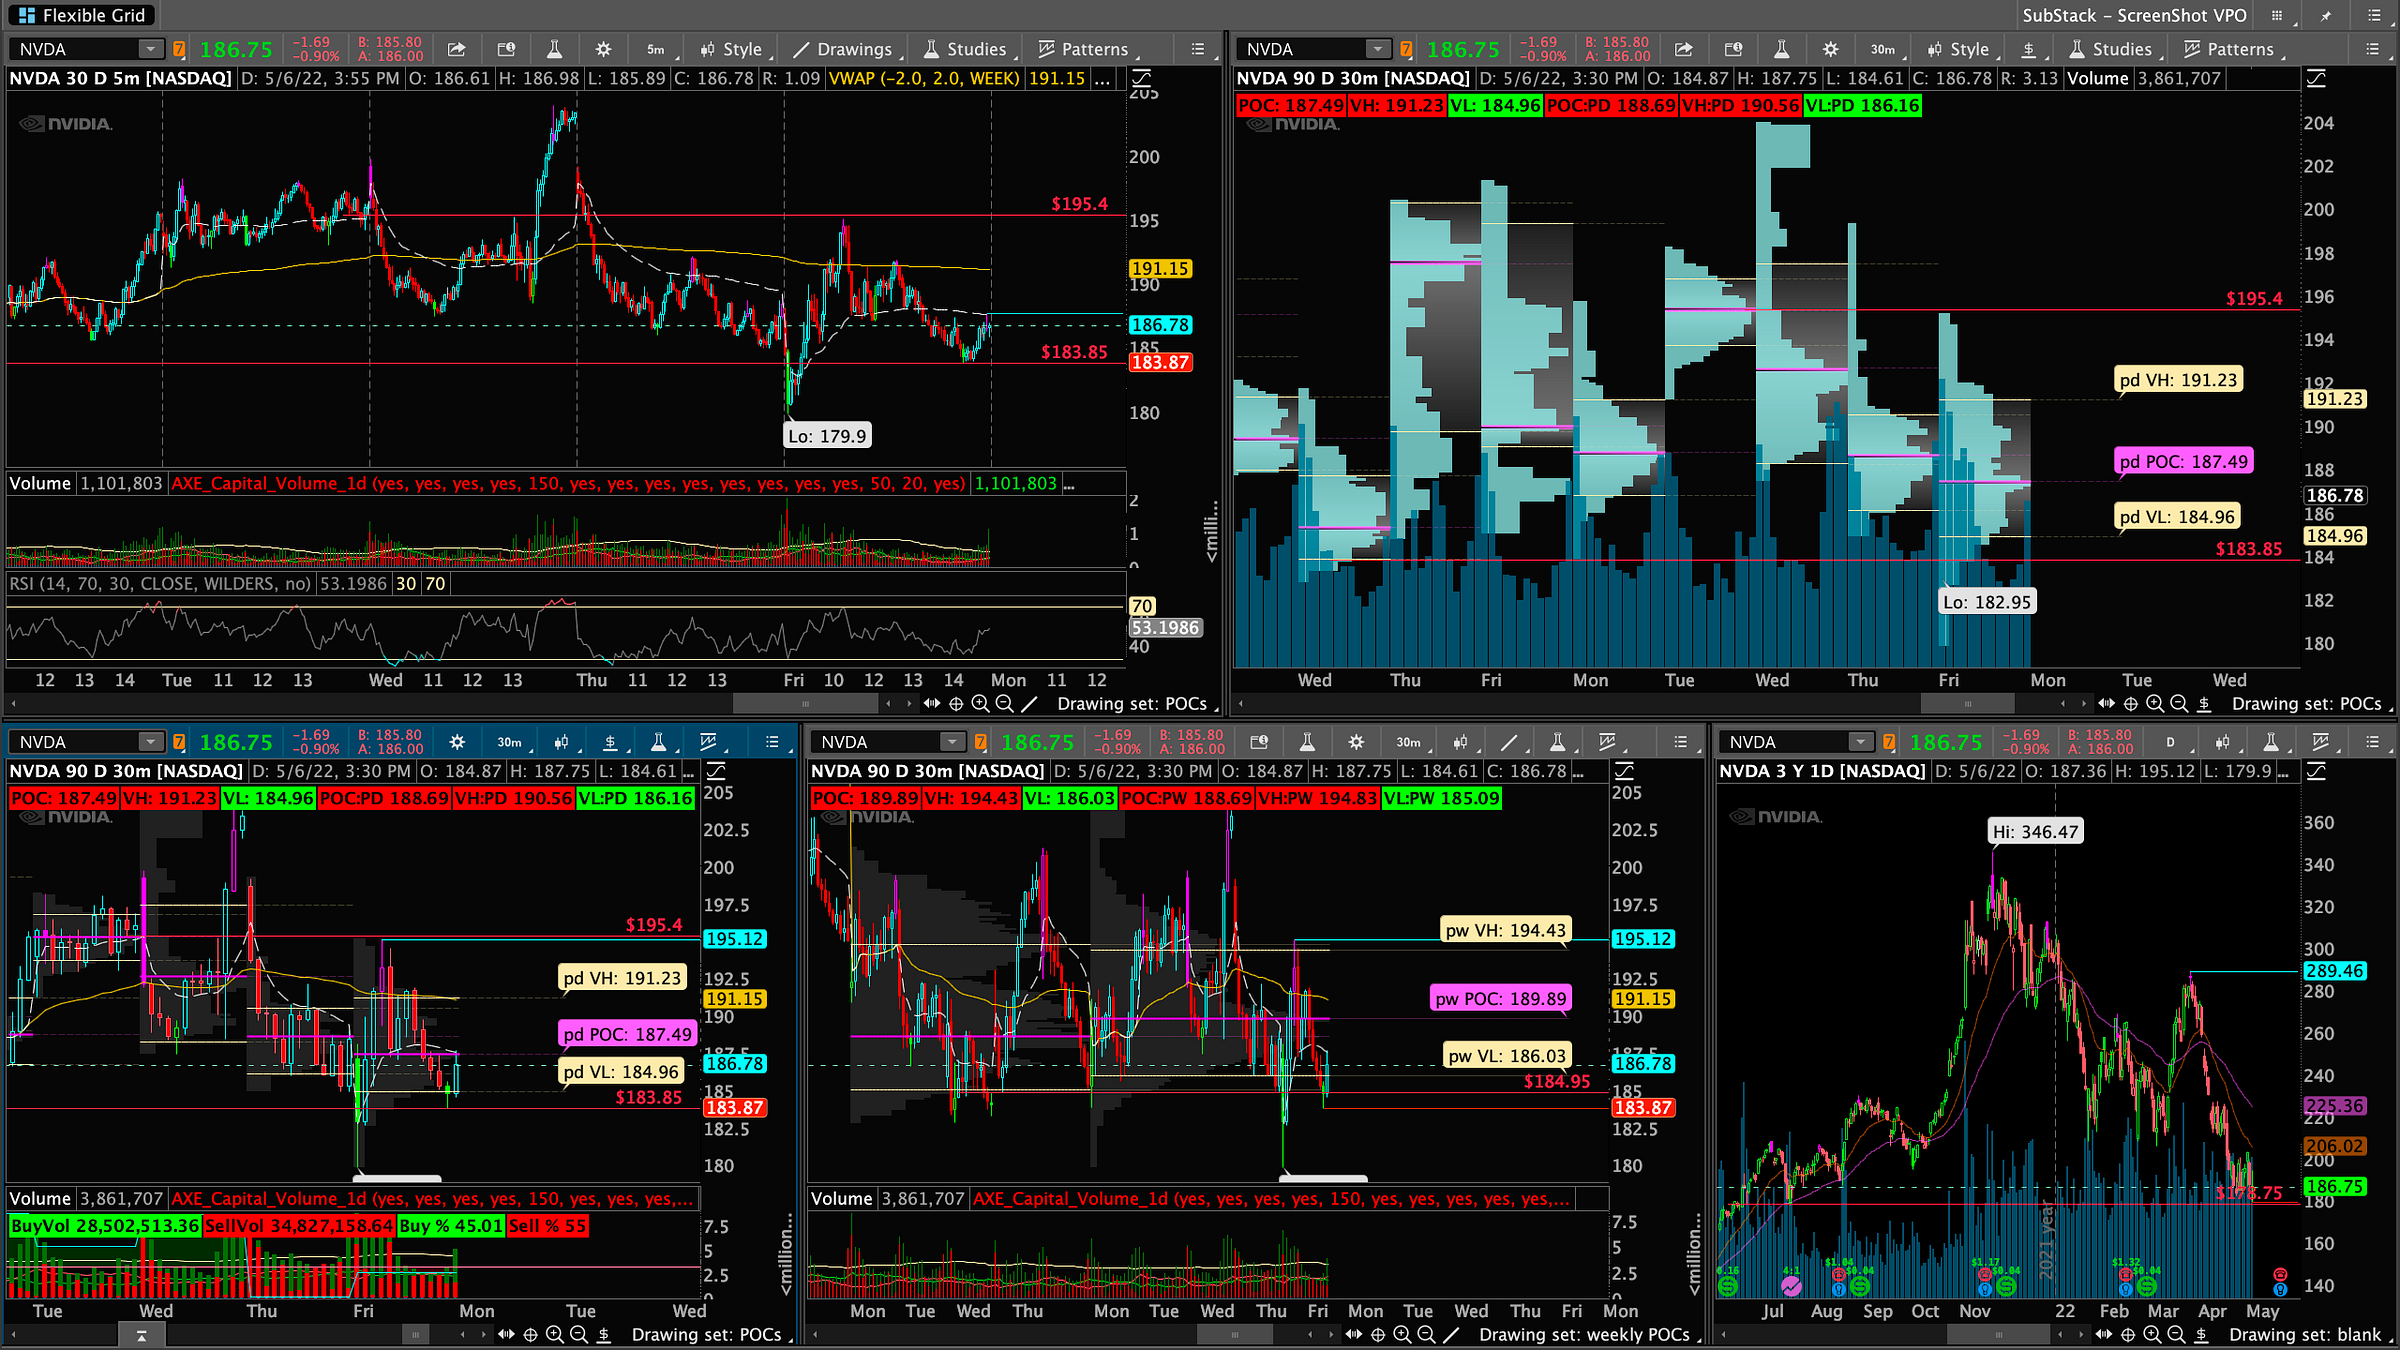
NVDA
Opened up below PD POC we sliced though my levels but found real right around the key 178 zone from the daily chart (bottom right pic). Once again for the 10th time same style almost as /ES SPY etc dip rip then dip rip. Rising wedge > falling wedge. Yet we managed to close below 188 reject Daily VWAP into close.
Monday Game Plan:
- OPEN Above POC - 187.49 - If we gap up we could manage to reclaim that weekly VWAP at 191.15 and if we can get over that 195.40 POC from a few days ago that we rejected hard off today that be a good sign. Above that we can push higher and follow with AMD but AMD may be the leader here.
- OPEN Below POC - 187.49 - Since we closed below POC we could go back to 178 level one daily chart that we keep chopping around. Below that it gets real ugly 160 is the next big zone and could be a slow grind down with head fakes along the way or elevator down. Based on AMD looking overall strong I think we can hold this 178 zone for a little longer unless /ES comes below 4000 to 3900/3850.
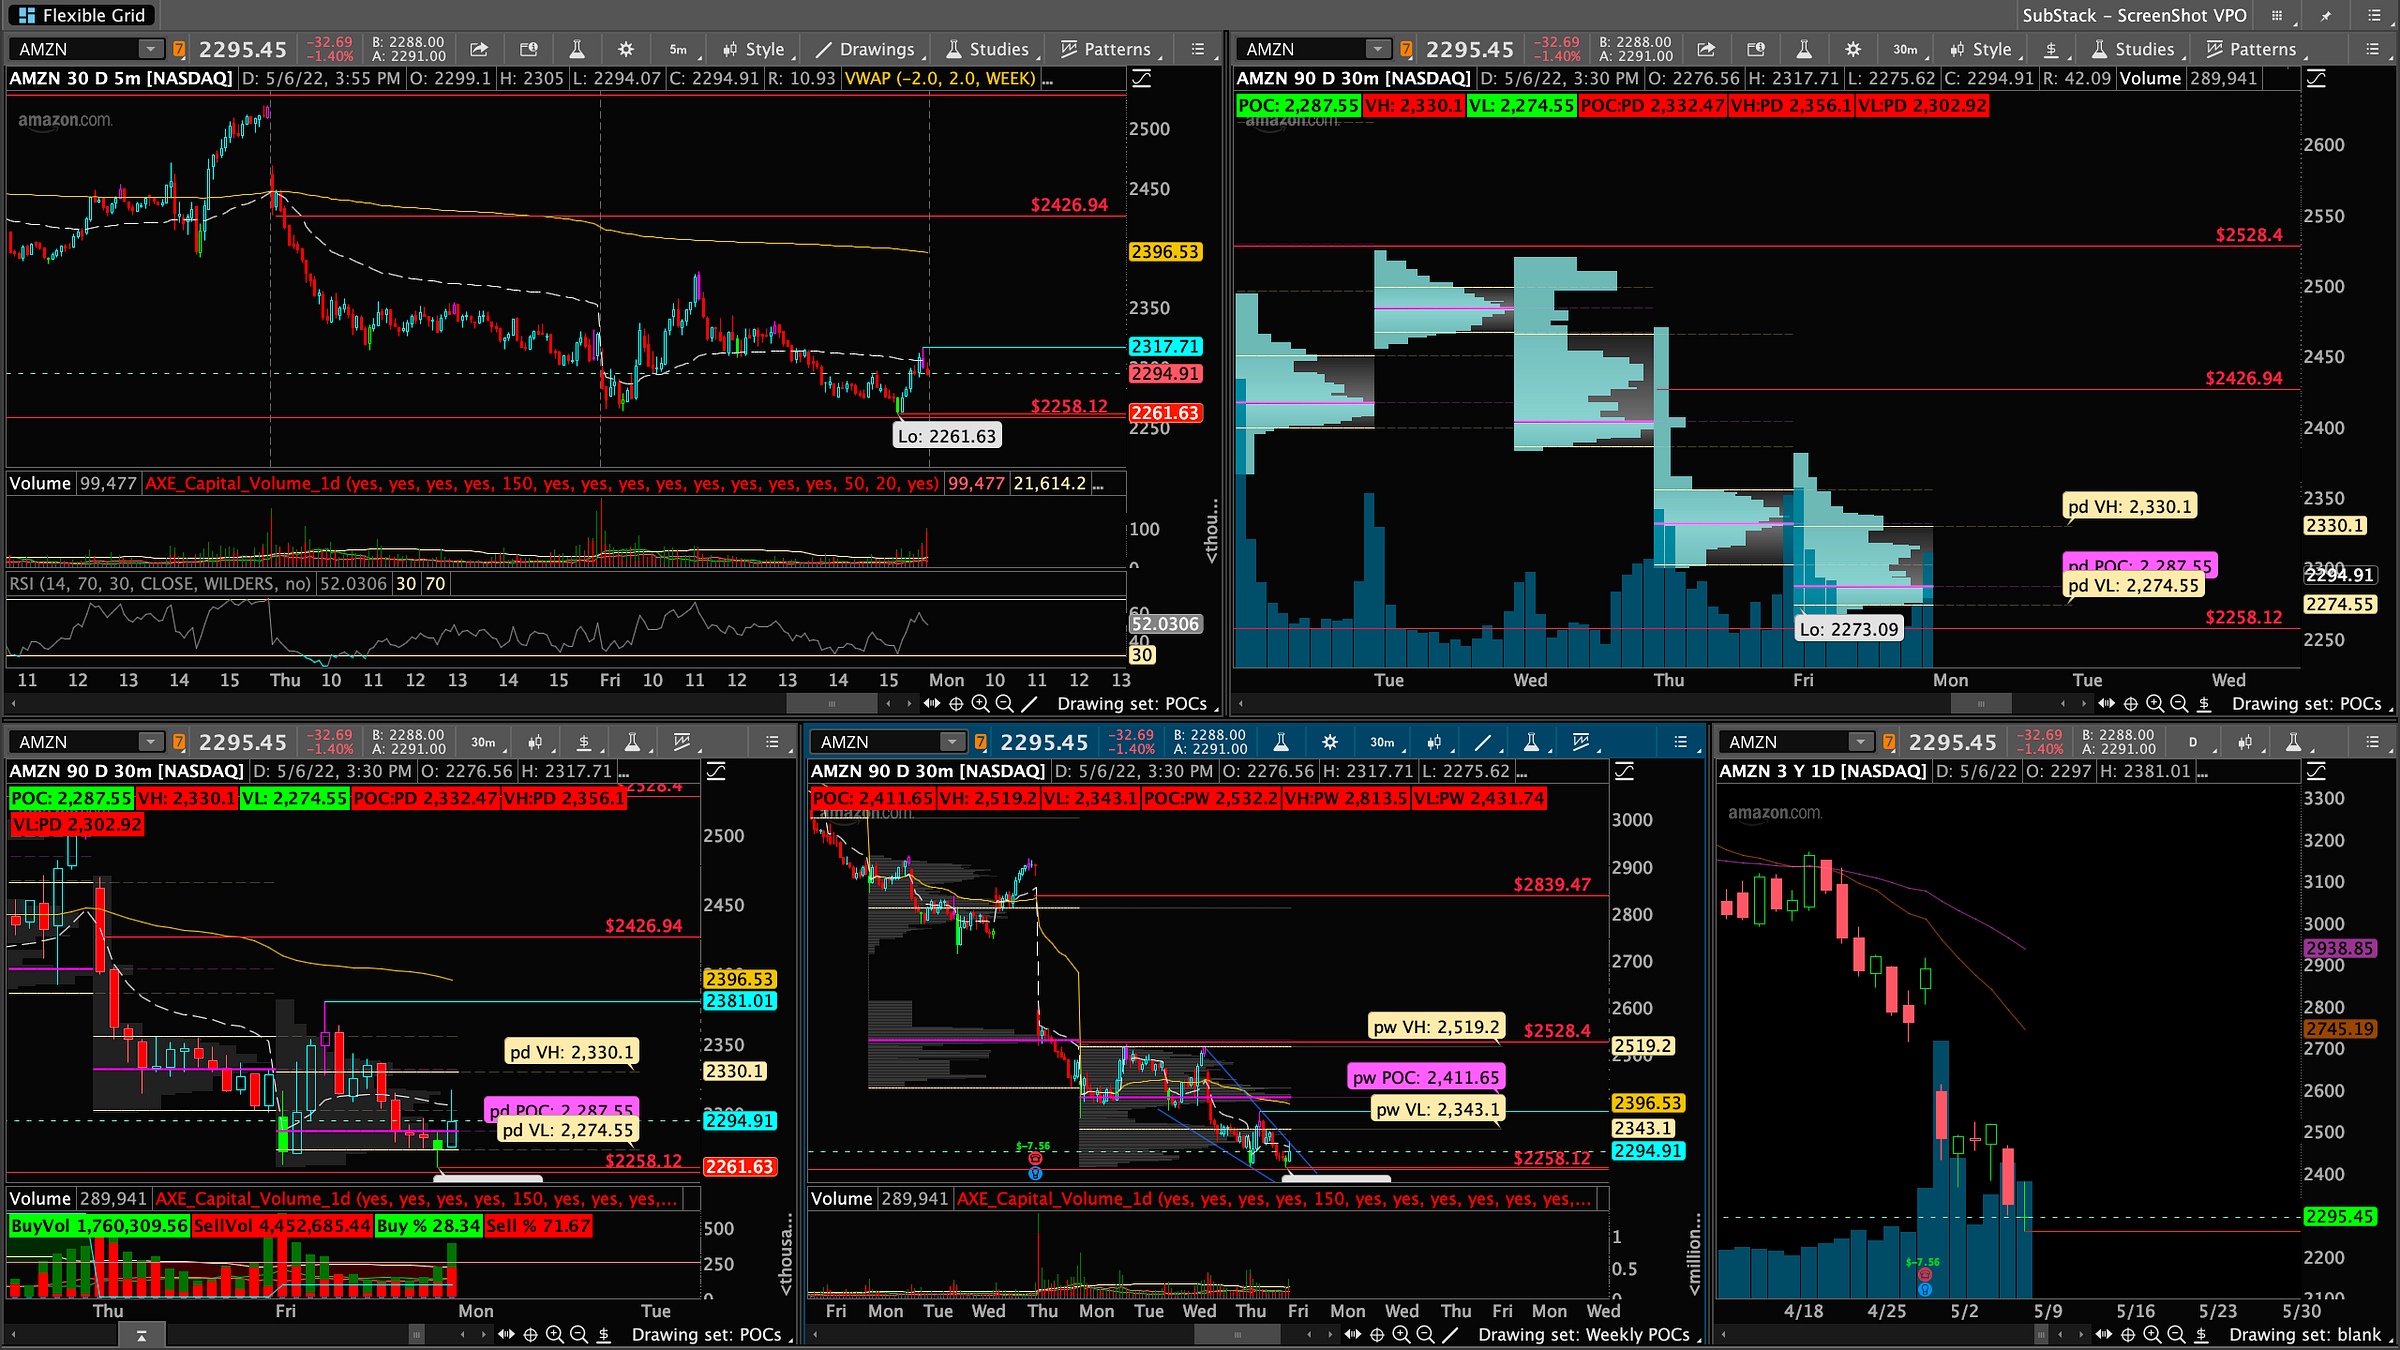
AMZN
As stated in Thursday night Game plan we opened below POC and making another LOW on the daily chart however, we closed it as a doji. (common reversal candle pattern). We had a HARD rejection off previous VH and came back down to 2261 range almost to double bottom yet still managed to close below Daily VWAP but above POC! Will be keeping my eyes on this for a relief bounce soon if we can reclaim that 2,400 zone which is weekly POC. Also looks like a falling wedge on the 30min time frame which could also play out nicely with the doji candle for a reversal next week!
Monday Game Plan:
- OPEN Above POC - 2,287.55 - We start the reversal and grind back up to weekly VWAP 2,396 and weekly POC 2,411I.
- OPEN Below POC - 2,287.55 - If we manage to gap down we will see a crack of 2261 level most likely and head to 2,200 level.
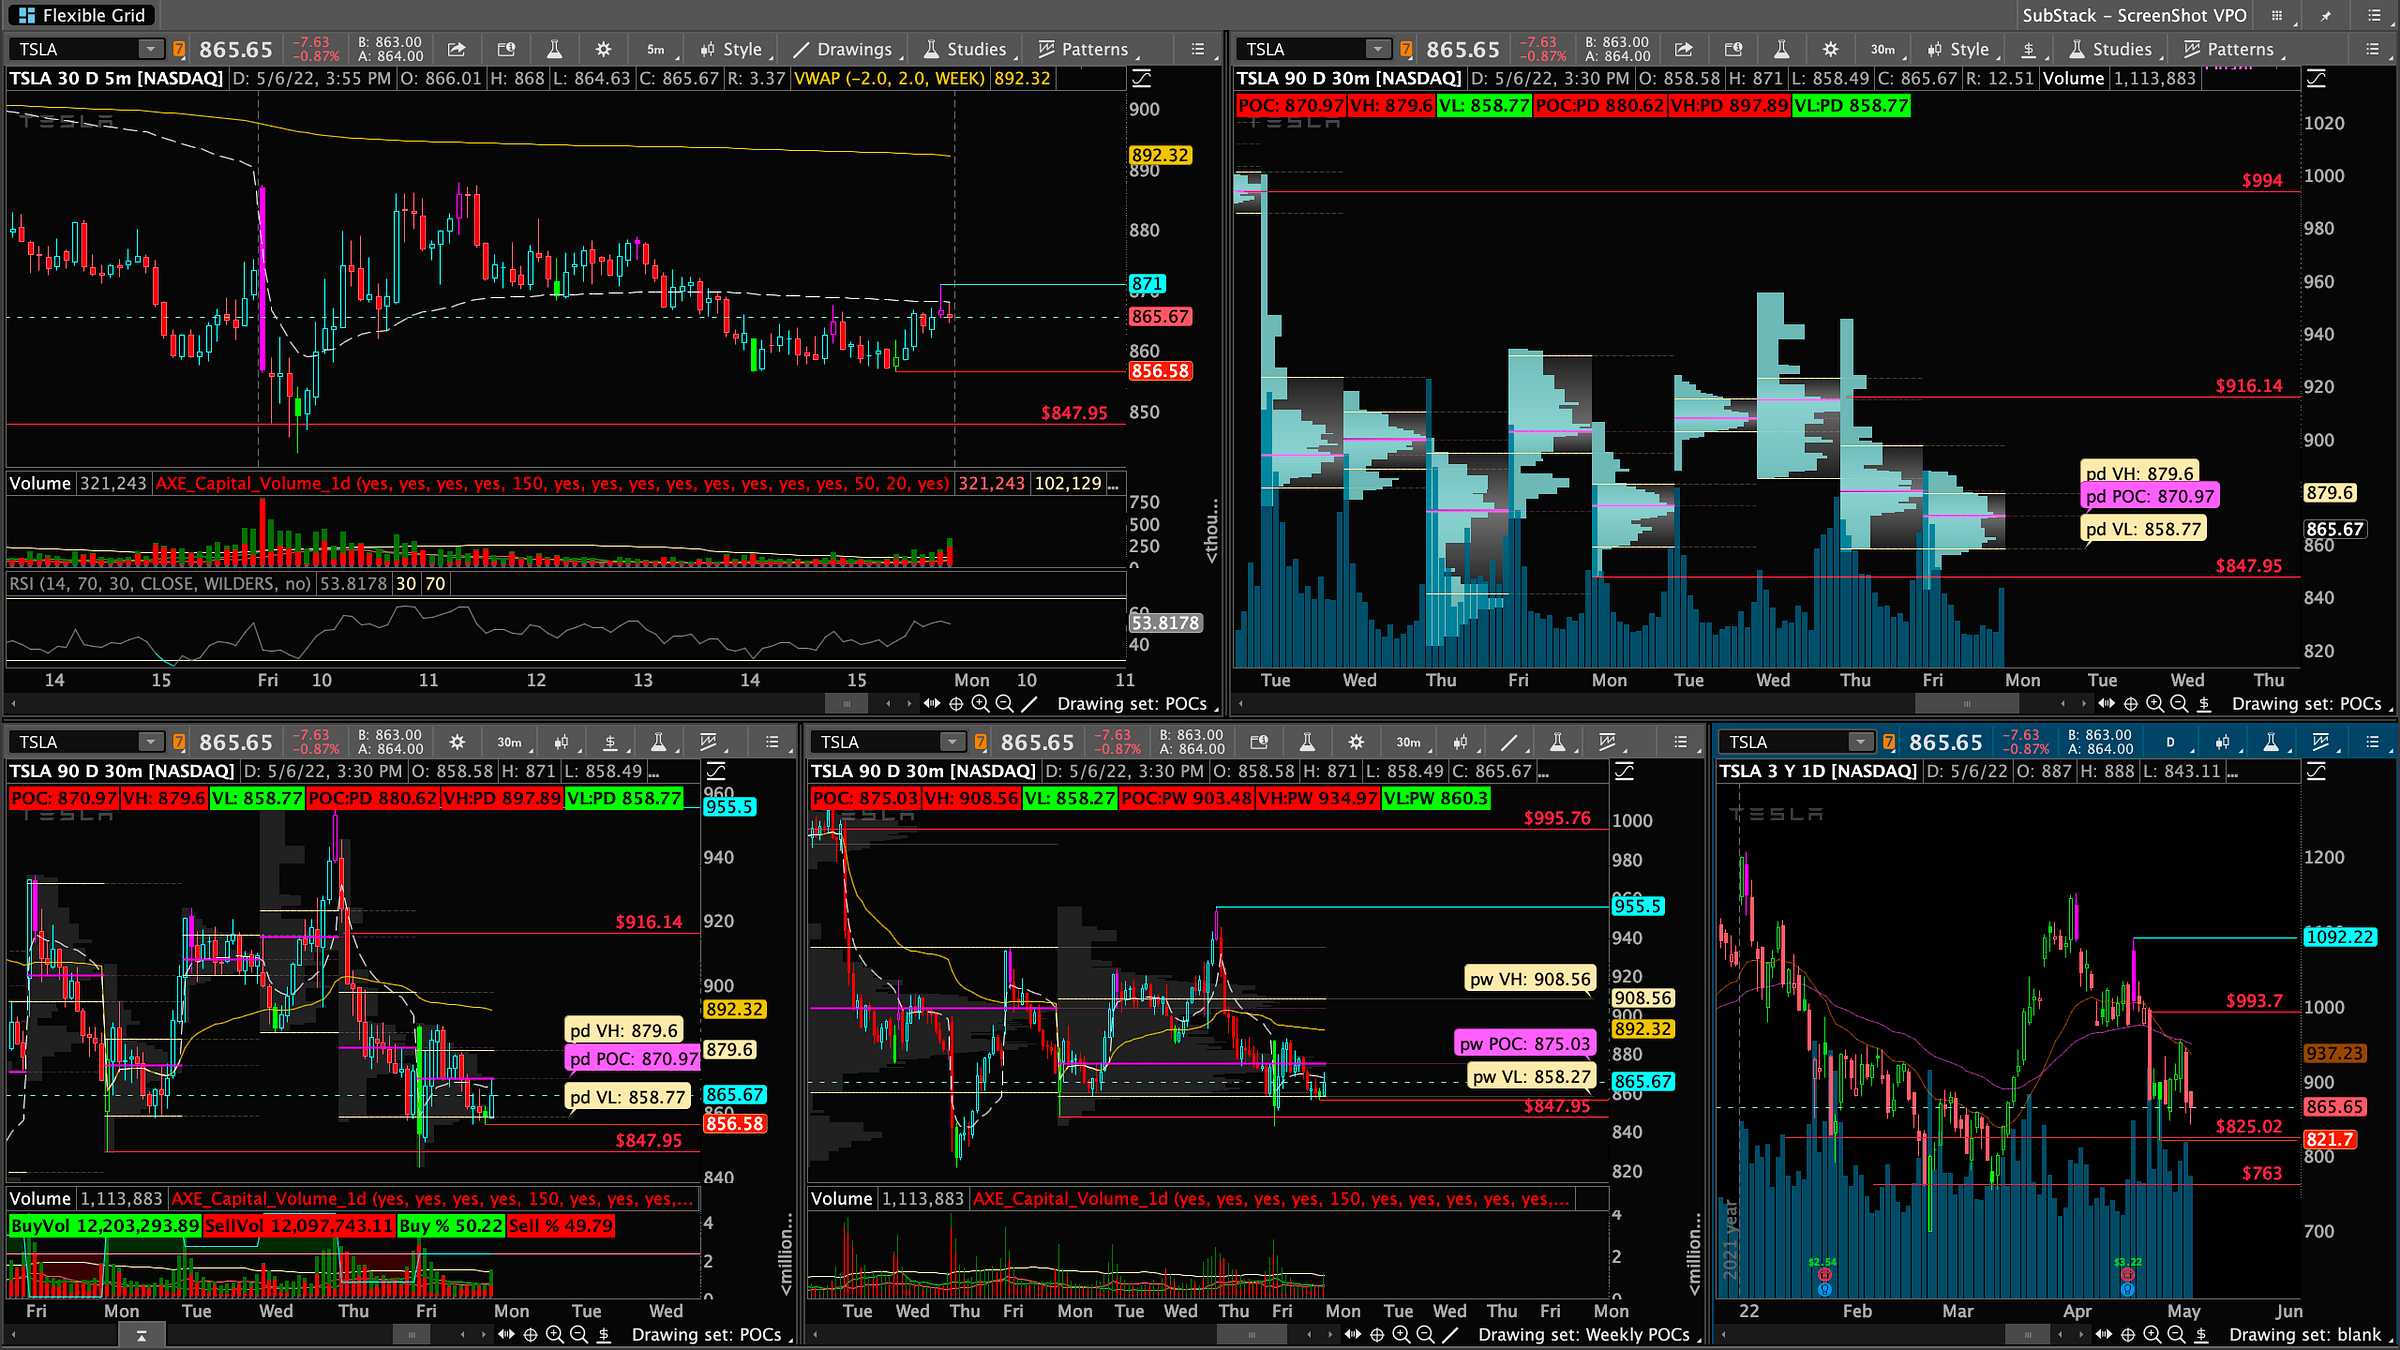
TSLA
2 key factors here in play that helped with TSLA bounce.
- 847.95 - Is the 858 zone of the weekly VL
- 858.77 - Is the PD VL that we managed to close above
Monday Game Plan:
- OPEN Above POC - 870.6 - Need to gap up over this and then retest it as support. If we manage to get over it we could retest VH 879.60 which is Thursday POC and then that 900 big psych level.
- OPEN Below POC - 870.6 - We retest 858.77 for support which is the weekly VL and below that 850 psych level. We managed to bounce 2x from this 847/750 range already a 3rd time will be a triple bottom or fatal down to 820 zone. 763 zone we bounced off a few days if you look at the daily chart.
If you enjoyed this sub stack I will be sure to post each daily a review of the market! Please share and subscribe!
Thanks for reading PHOENIX Capital Newsletter! Subscribe for free.
Click to Join Free Charts & Notifications about new posts and Intra Day Charts
→ Join AXELORD Telegram for notifications
Thank you for reading PHOENIX Capital Newsletter. Please share on Twitter!
Disclaimer: This newsletter is not trading or investment advice, but for general informational purposes only. This newsletter represents my personal opinions which I am sharing publicly as my personal blog. Futures, stocks, bonds trading of any kind involves a lot of risk. No guarantee of any profit whatsoever is made. In fact, you may lose everything you have. So be very careful. I guarantee no profit whatsoever, You assume the entire cost and risk of any trading or investing activities you choose to undertake. You are solely responsible for making your own investment decisions. Owners/authors of this newsletter, its representatives, its principals, its moderators and its members, are NOT registered as securities broker-dealers or investment advisors either with the U.S. Securities and Exchange Commission, CFTC or with any other securities/regulatory authority. Consult with a registered investment advisor, broker-dealer, and/or financial advisor. Reading and using this newsletter or any of my publications, you are agreeing to these terms. Any screenshots used here are the courtesy of Think or Swim. I am just an end user with no affiliations with them.

