
This will be a series of EDU Content so TAKE YOUR TIME and go through it carefully. This part covers Volume Profile! 😎
VOLUME PROFILE SECTIONS:
- What is Volume when it comes to trading?
- What are NODES?
- HIGH vs LOW volume NODES
- Value Area - $ Price Rotation
- 3 KEY Parts of VALUE Area? “VAH” “VAL” “POC”
- Types of “Time Per Profile”
- 4 Common Volume Profile SHAPES - D P B b
- How to use for ENTRY/ EXIT
- ABOUT ME - WHY DO I DO ALL THIS FOR FREE? For YOU!
- Daily Game Plan - What Is That?
We do FREE Live Streams showing you how to set up your charts and analyze charts with Volume Profile in the Discord while I screen share - To Join Just Click Here
Also, I sent out a Morning Text $SPY with upside/downside levels. It's free just text me SPY to my cell +1 (609) 604-7619
1. What is VOLUME when it comes to trade?
It represents the number of shares/contracts of a security “stock” traded between buyers and sellers “you and me”. When trading stocks volume is in number of shares. In futures and options it is measured in contracts.
With volume profile instead of it being on the X axis “bottom” of the chart it is on the Y axis “left" side horizontally. In the picture below it is the BLUE Sideways bars.
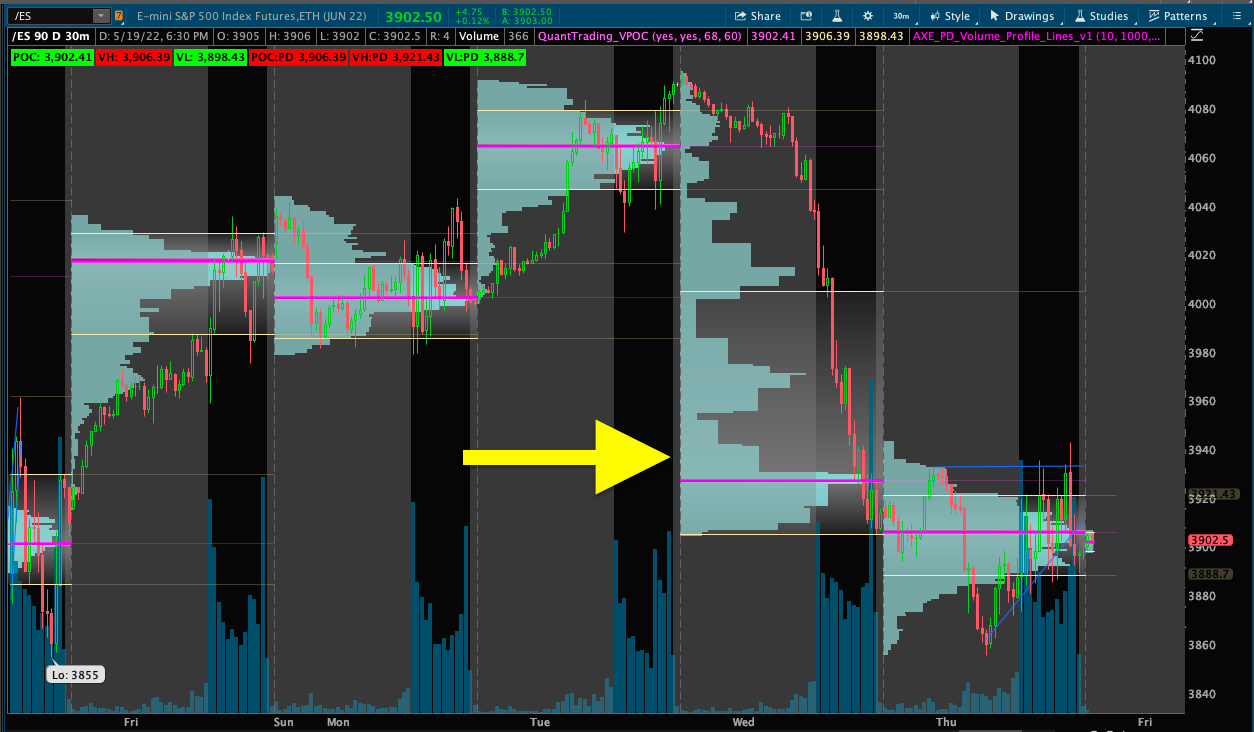
Volume profile shows us volume traded for a SPECIFIC PRICE instead of time like market profile. Two different types of profile.
Every time a contract is traded the volume profile builds out to the right as more and more contracts are traded at that price.
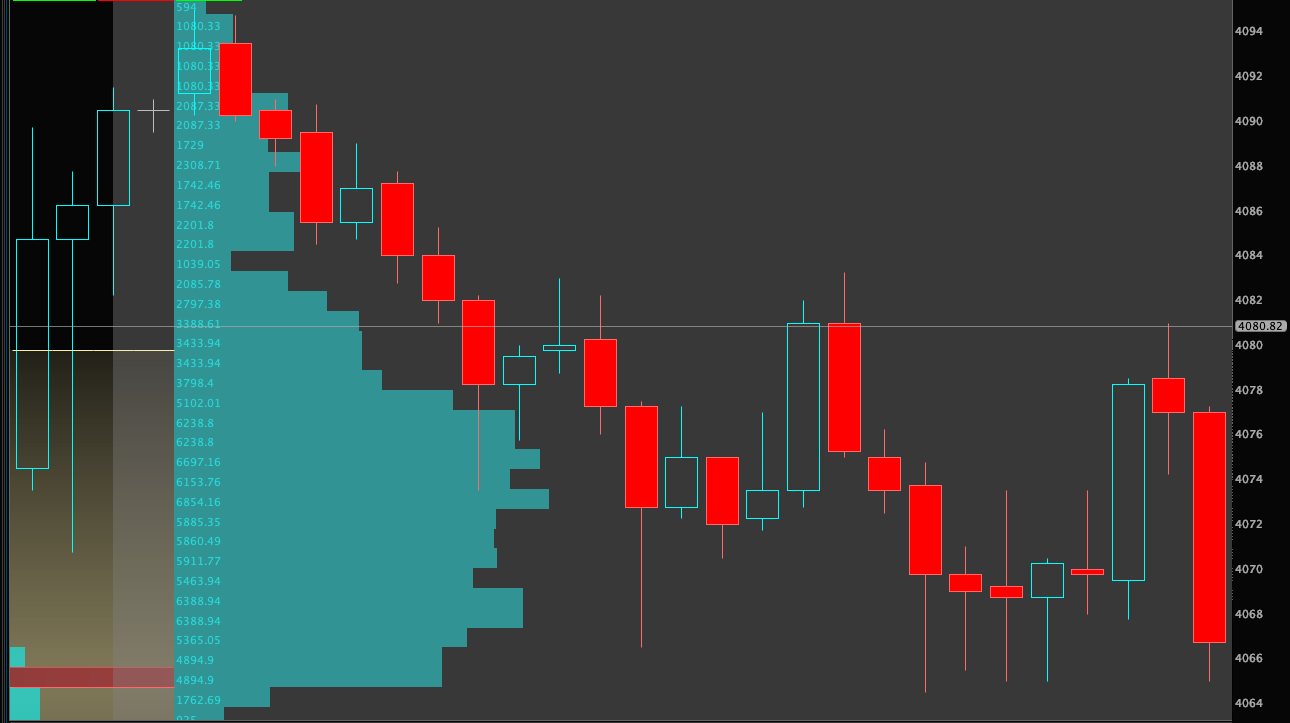
2. NODES: What are nodes?
When you zoom all the way in on volume profile you can see the size of each node. These price levels are called nodes and measure the amount of contracts traded within a specific price point.
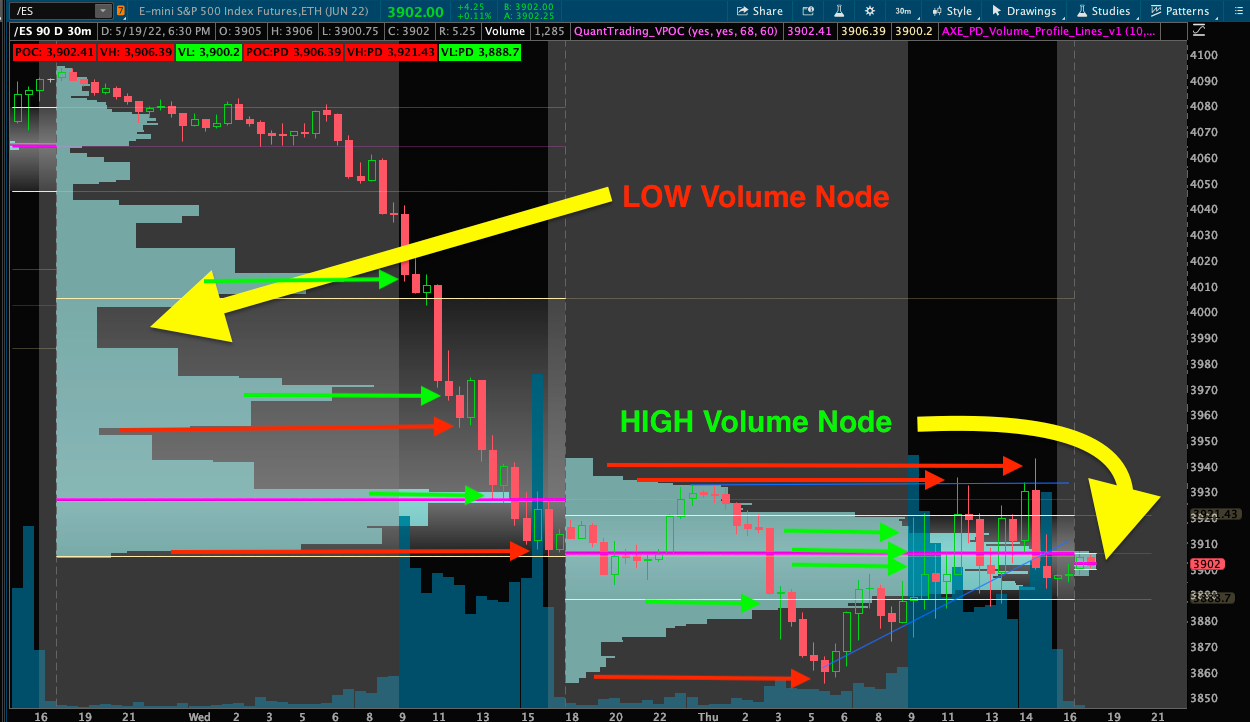
3. HIGH Volume Nodes vs LOW Volume NODES.
HIGH Volume Nodes: (GREEN ARROWS —> in picture below) Are were a HIGH number of contracts are traded so it is slow for price to move through these nodes sometimes.
- BALANCE - When there are high volume nodes it means there is balance forming and that market participants agree on a price also know as “fair value”
LOW Volume Nodes: (RED ARROWS —> in picture below) Are were a LOW number of contracts are traded so it is fast for price to move through these nodes usually.
- IMBALANCE - When there is a market imbalance price moves very fast until it finds a “fair” value.
- Sometimes price will move quickly to a LOW NODE which they call vacuums so sometimes they will wick to them. (Look at where the wicks are in the picture and they are where the LOW Volume Nodes are.
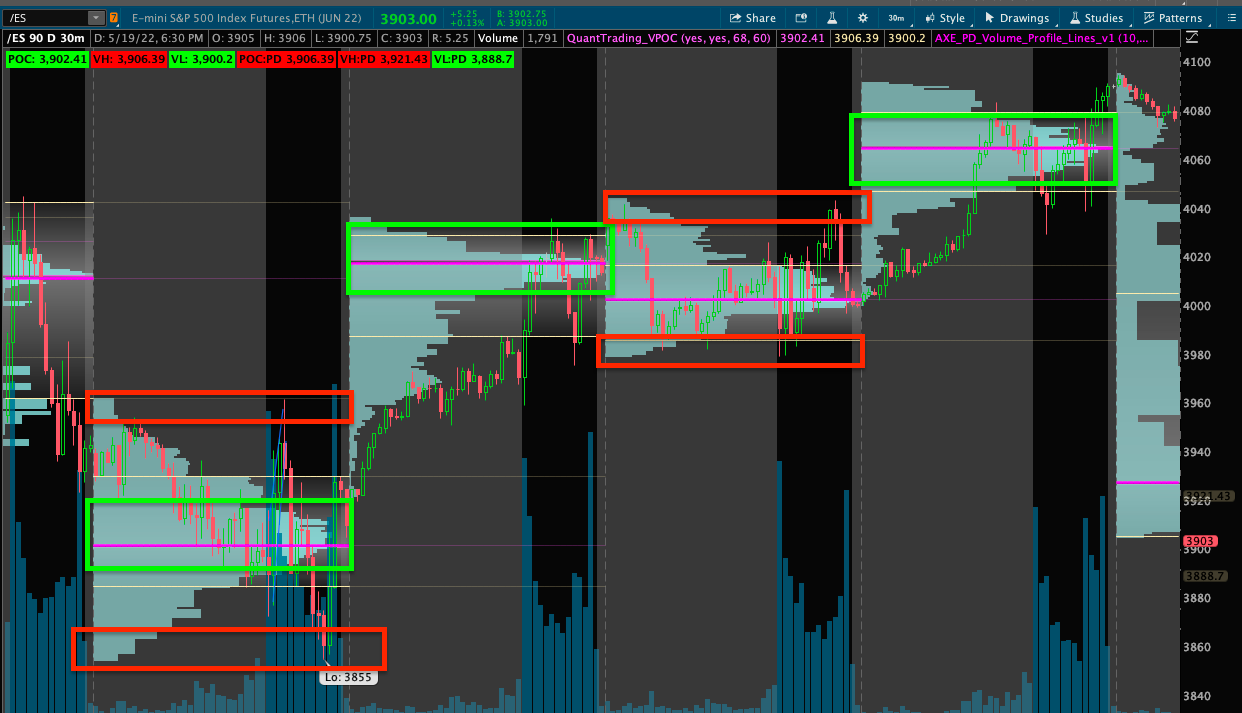
4. EXAMPLE: See Picture Below of “PRICE ROTATION”
RED - LOW Vol. NODE Section
GREEN - HIGH Vol. NODE Section
HIGH VOLUME NODES: (GREEN BOX —> in picture below) Usually accept price and a range bound rotation of the profile will take price where price will hang around for awhile while it accepts a previous fair value price.
LOW VOLUME NODES: (RED BOX —> in picture below) Usually reject price and are moved back to a high volume node area.
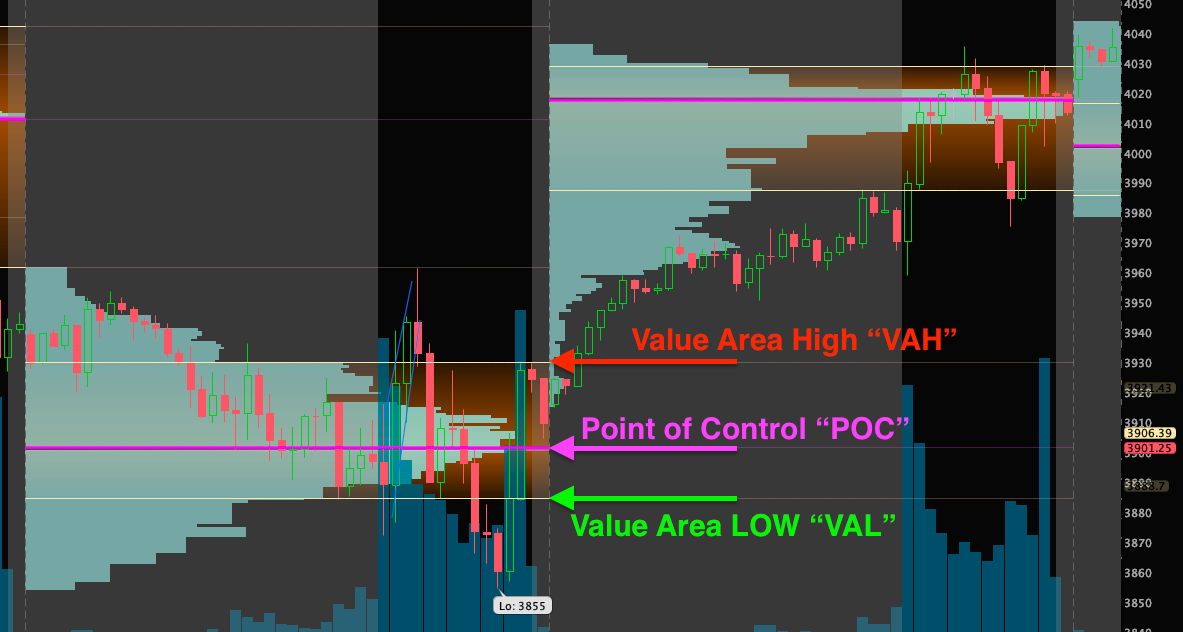
5. 3 KEY Parts of VALUE Area? “VAH” “VAL” “POC”
Value area is where 70% of the accumulated volume takes place within that profile. I personally use 68% and some others use that too as 68% represents the “empirical rule” which tells you where most of the values lie in a normal distribution. 68% of value is within 1 deviation of the mean.
- Value Area “VA” - The ORANGE highlighted 68% section is the VA!
- Value Area HIGH “VAH” - The highest price of the value area.
- POINT of CONTROL - Where the MOST amount of volume takes place.
- Value Area LOW “VAL” - The lowest price of the value area.
6. Types of “Time Per PROFILE” ?
You can use a DAILY Profile which builds 1 profile per day or a weekly profile which builds a profile for the week!
You can even do minute, hour, week, month, quaterly. Most common is day and week.
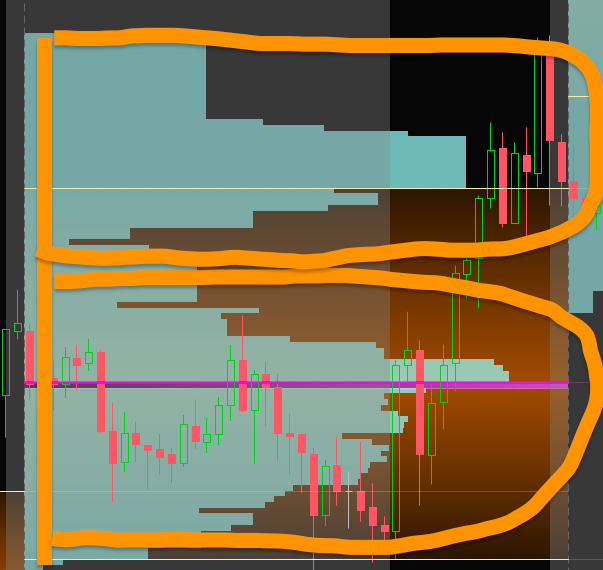
7. Common Volume Profile Shapes - D, P, B, b,
There are 4 common patterns with volume profile that are have a meaning and can give clues as to direction of where the market is!
“D” Shape Profile
A “D” shape profile is a balanced profile that has sideways action and range. usually choppy when there is a D profile as it’s a period of consolidation. This range can be noted for breakout trades once it leaves outside the profile.
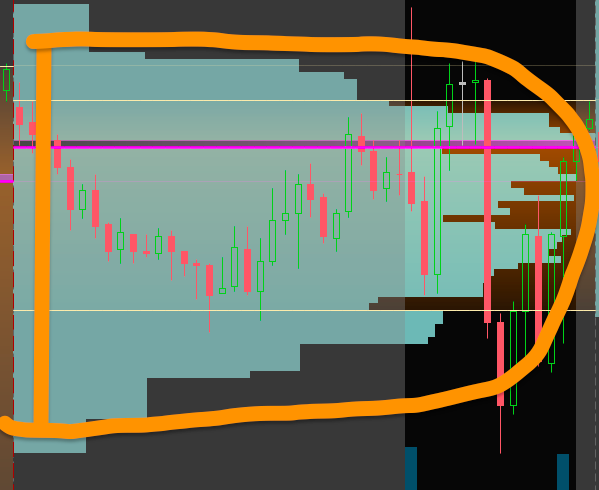
“P” Shape Profile
A “P” shape profile is when a breakout occurs then consolidation occurs. Remember how we talked about LOW volume NODES, see how fast price moved through the low volume nodes it did not find balance or “fair” price until the top of the P profile within the value area “VA”. A “P” shape is usually formed when shorts are covering.
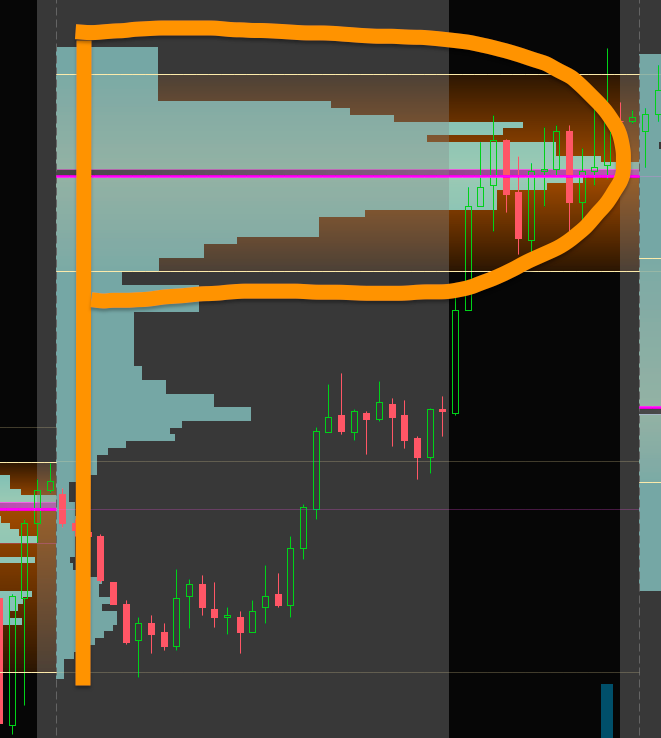
“B” Shape Profile
The “B” shape is similar to the D profile but slightly different. See how PRICE hung around for a while in BOTH top and bottom section of the B balanced took place within each portion of the B and could be said to have 2 value areas. However The bottom portion if where most of the volume took price as was more dominant.
“b” Shape Profile
A LOWERCASE “b” shape profile is formed when price falls or rises sharply then consolidates. Unlike a “P” profile, a “b” profile can represent a long liquidation that took place. They are usually found in downtrends before balance is found.
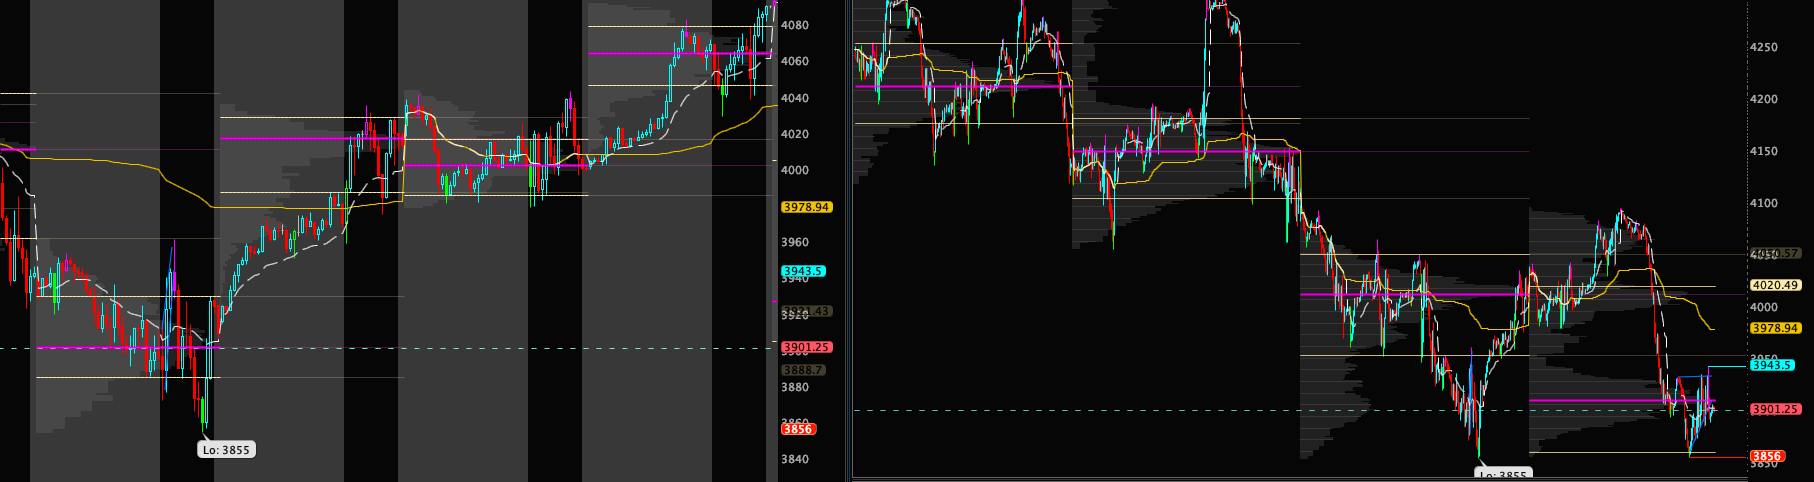
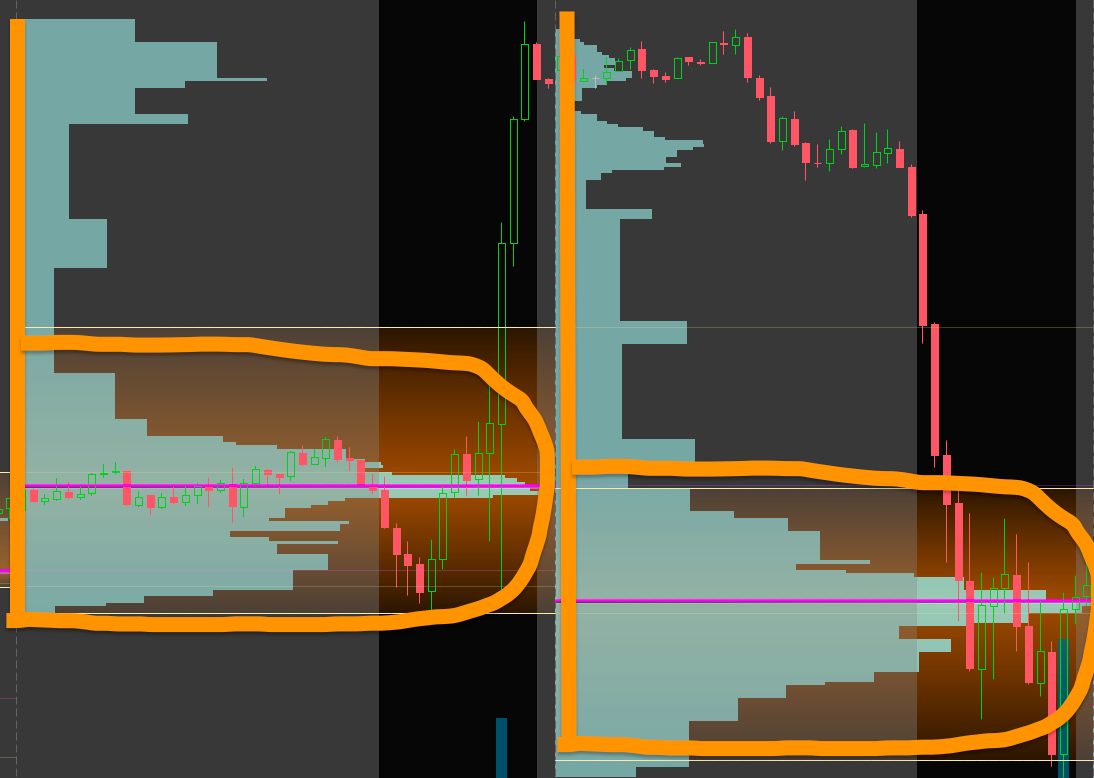
SPECIAL EXAMPLE - VERY UNIQUE CASE In Picture:
See how on the LEFT we a “b” price hovered around the bottom then violently ripped higher and we have a lot of LOW VOLUME NODES. Price rejected it the next day as that was an imbalance and no “fair” price was agreed on up there.
On the RIGHT the next day since price rejected it came right down and did not agree price was “fair” at the previous day point of control “POC” It went slightly lower and build a value area half of yesterdays profile from the previous day POC which became the value area high “VH” of the second day and then the new low was below the previous day value area low “VL”
8. How To Use Volume Profile for ENTRY / EXIT
So each morning when the market opens I look at the PREVIOUS DAY Point of Control “PD POC” to see if we are opening above or below. I also chart out manually the lines of vPOCs and PD POC VH VL.
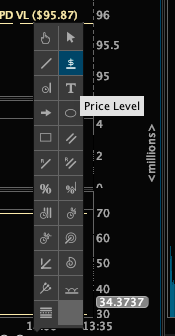
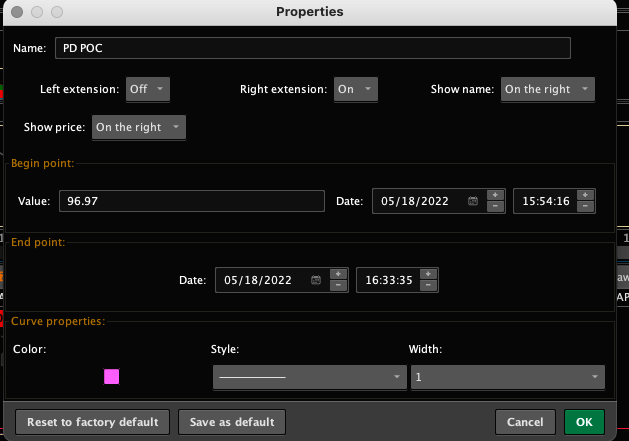
You can click the drawing tool and click price level and plot out the level. Then RIGHT CLICK and change the settings to the second picture and type in a name. RIGHT EXTENSION “ON”, SHOW NAME “On The Right” and SHOW PRICE LEVEL"On The Right”. You can even create a drawing set and call it 5m “for the 5min chart you have your levels plotted for the 5min or 1min intra day time frame and then on the 30min chart the plot levels are not in the way of the Volume Profile as you can see in my example below I have a drawing set called “blank”.
Scroll down to see how I use these levels for entry and exit.
For TradingView use the “horizontal ray” and right click same settings".
- OPEN BELOW PD POC: If we open above the PD POC I look to play the upside as if we bounce and hold the PD POC or or just continue to rip higher I look at the PD value area high “PD VH. If we get through that the next VL or POC called a V POC “VIRGIN POINT OF CONTROL” an untested level of heavy volume. Can often act as a strong magnet or heavy resistance once tested. If we gap over a vPOC I take not of that and look at the levels above but that level is still in play since it is yet to be tested. Previous vPOCs that have been tested may be tested again and can offer support or resistance.
- OPEN BELOW PD POC: If we open below the PD POC I look to play the downside as if we bounce the first level of resistance will be the PD POC. If we get through POC I look for a retest of POC or strength and momentum then play the “OPEN ABOVE POC" levels. If we reject PD POC, I look for the break to the downside and see if we slide down to previous day value area low “PD VL”. If that does not offer support I look at the next levels of days in that range of VH, POC and VL levels that may offer support. Sometimes I look at weekly chart to get a big picture perspective as if we are above the weekly POC or BELOW.
PICTURE EXAMPLE:
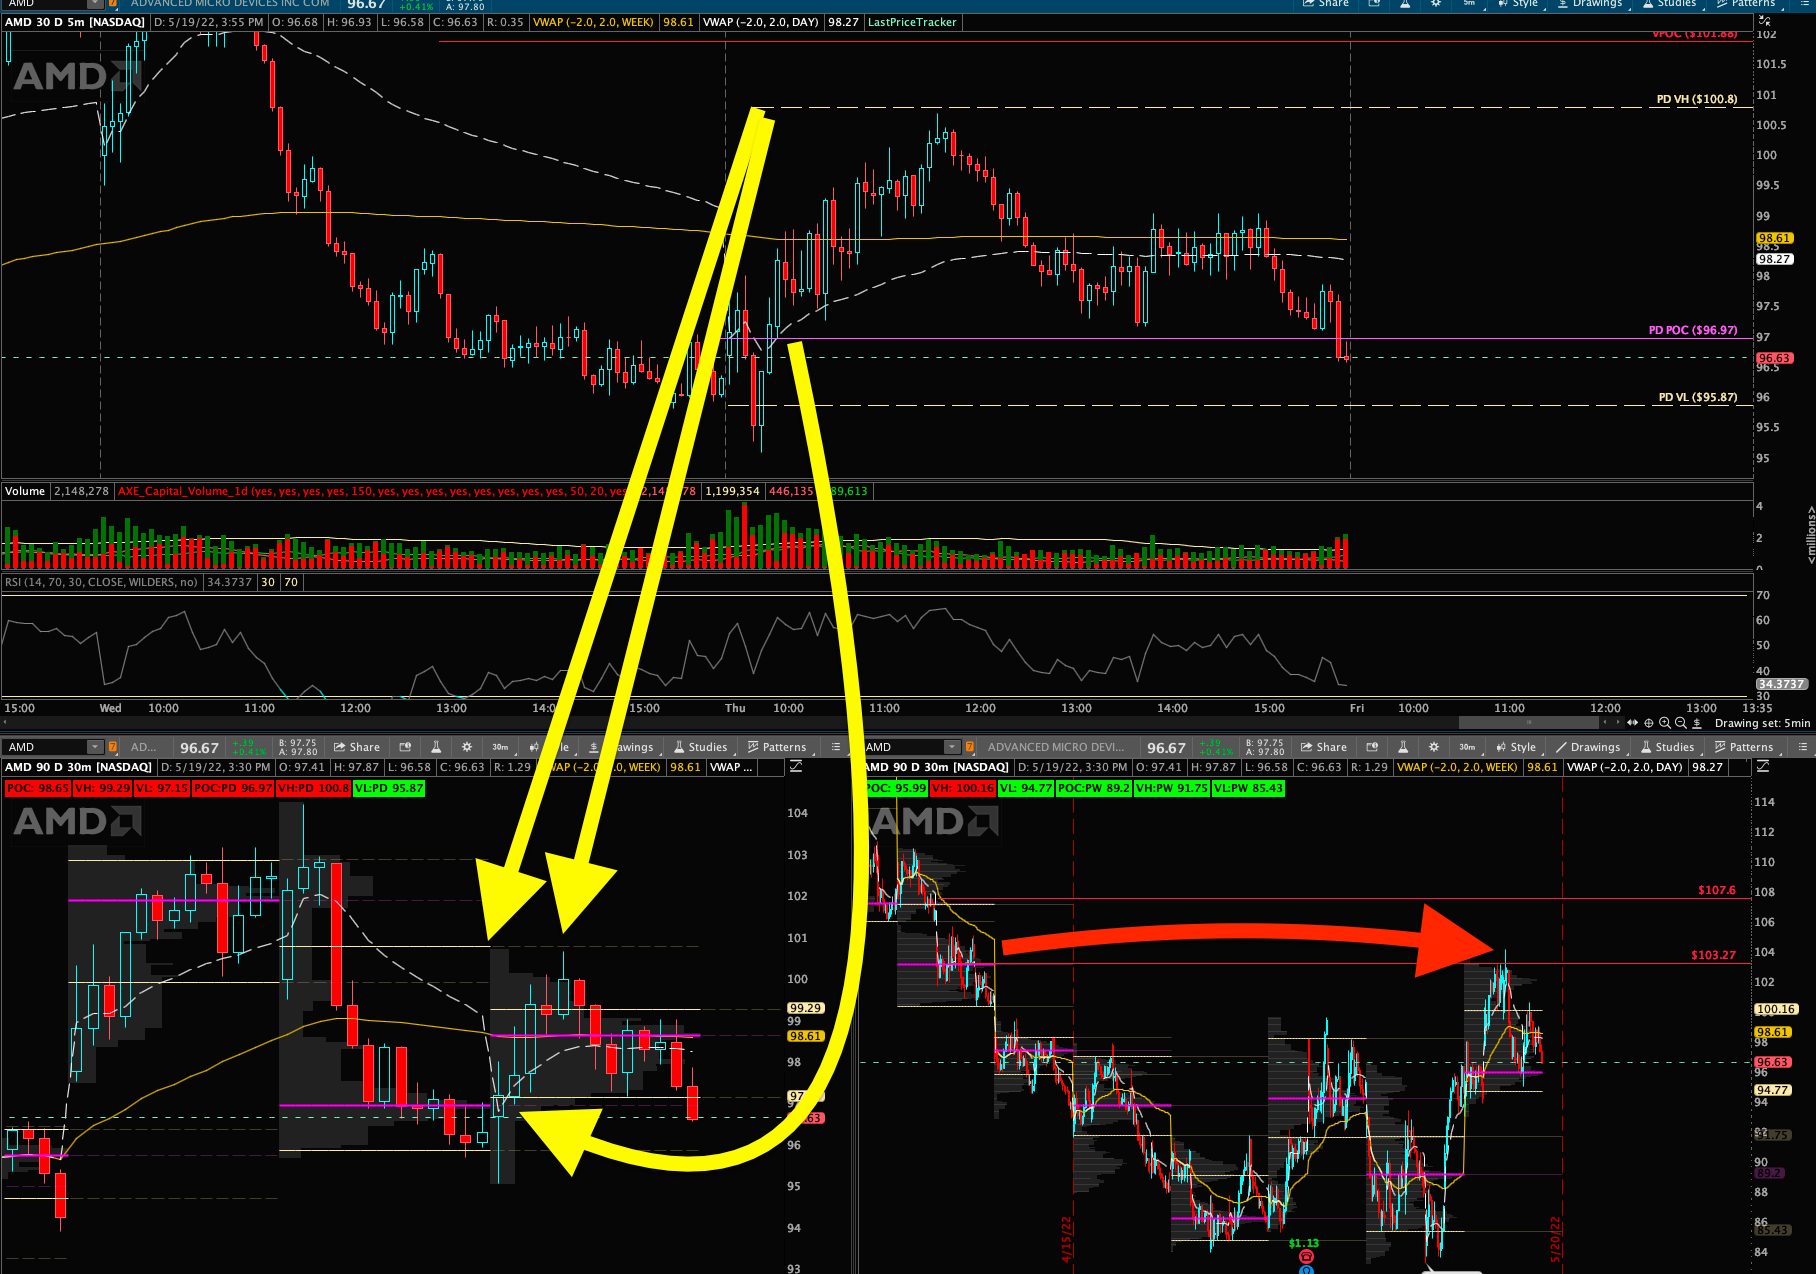
AMD Is a good example but can apply to any chart.
- The PD VH provided resistance today and was rejected. We came back down to PD POC after breaking daily and weekly vwap. If we stayed above it a candle open and close above vWAP, we would have possibly tested and broke above PD VH otherwise a double top pattern would have formed.
- End of the day we came below the PD POC and closed well below today’s POC so a bearish signal unless we gap up.
- On the weekly timeframe look to the right. The RED LINE 103.27 level was a WEEKLY vPOC that was NOT TESTED until we had a pop to that zone. It was a SHARP rejection and came right back down. That will be the key level to break once we get back above the weekly VH of 100.16
This is just an example of how I play entry and exits based off POC VH VL.
9. MY Volume Profile Setup!
WARNING SO YOU SEE CORRECT VALUES!!!!!
- VOLUME PROFILE works mainly on 30min chart where most people get their values from. IF you use a 5min chart with volume profile you will get different levels.
- I use “EXTENDED HOURS” ON for futures only like /ES /NQ but for STOCKS I TURN OFF “EXTENDED HOURS”.
I use think or swim and will provide a ThinkorSwim layout and a Trading View setup!
Trading View
To use Volume Profile you must have an upgraded account.
ONLY WORKS ON 30min so chart out those levels so you can use 5min etc using the “HORIZONTAL RAY” Line Draw Tool
Click "COPY" top right to save the template for yourself
https://www.tradingview.com/chart/efVAVGVq/
ThinkorSwim
My Custom Setup:
CUSTOM LABELS: Labels at the top chart show the POC VL VH for the day and then the PREVIOUS Day Values. RED if price is below the value and GREEN if price is above the value.
2 Layouts - 1 Intraday - 1 Post Market Review
SEE BELOW as when you import it MAY NOT LOAD CORRECTLY so FOLLOW INSTRUCTIONS HOW TO FIX is AT THE BOTTOM of this!!!
So I have 2 layouts I use.
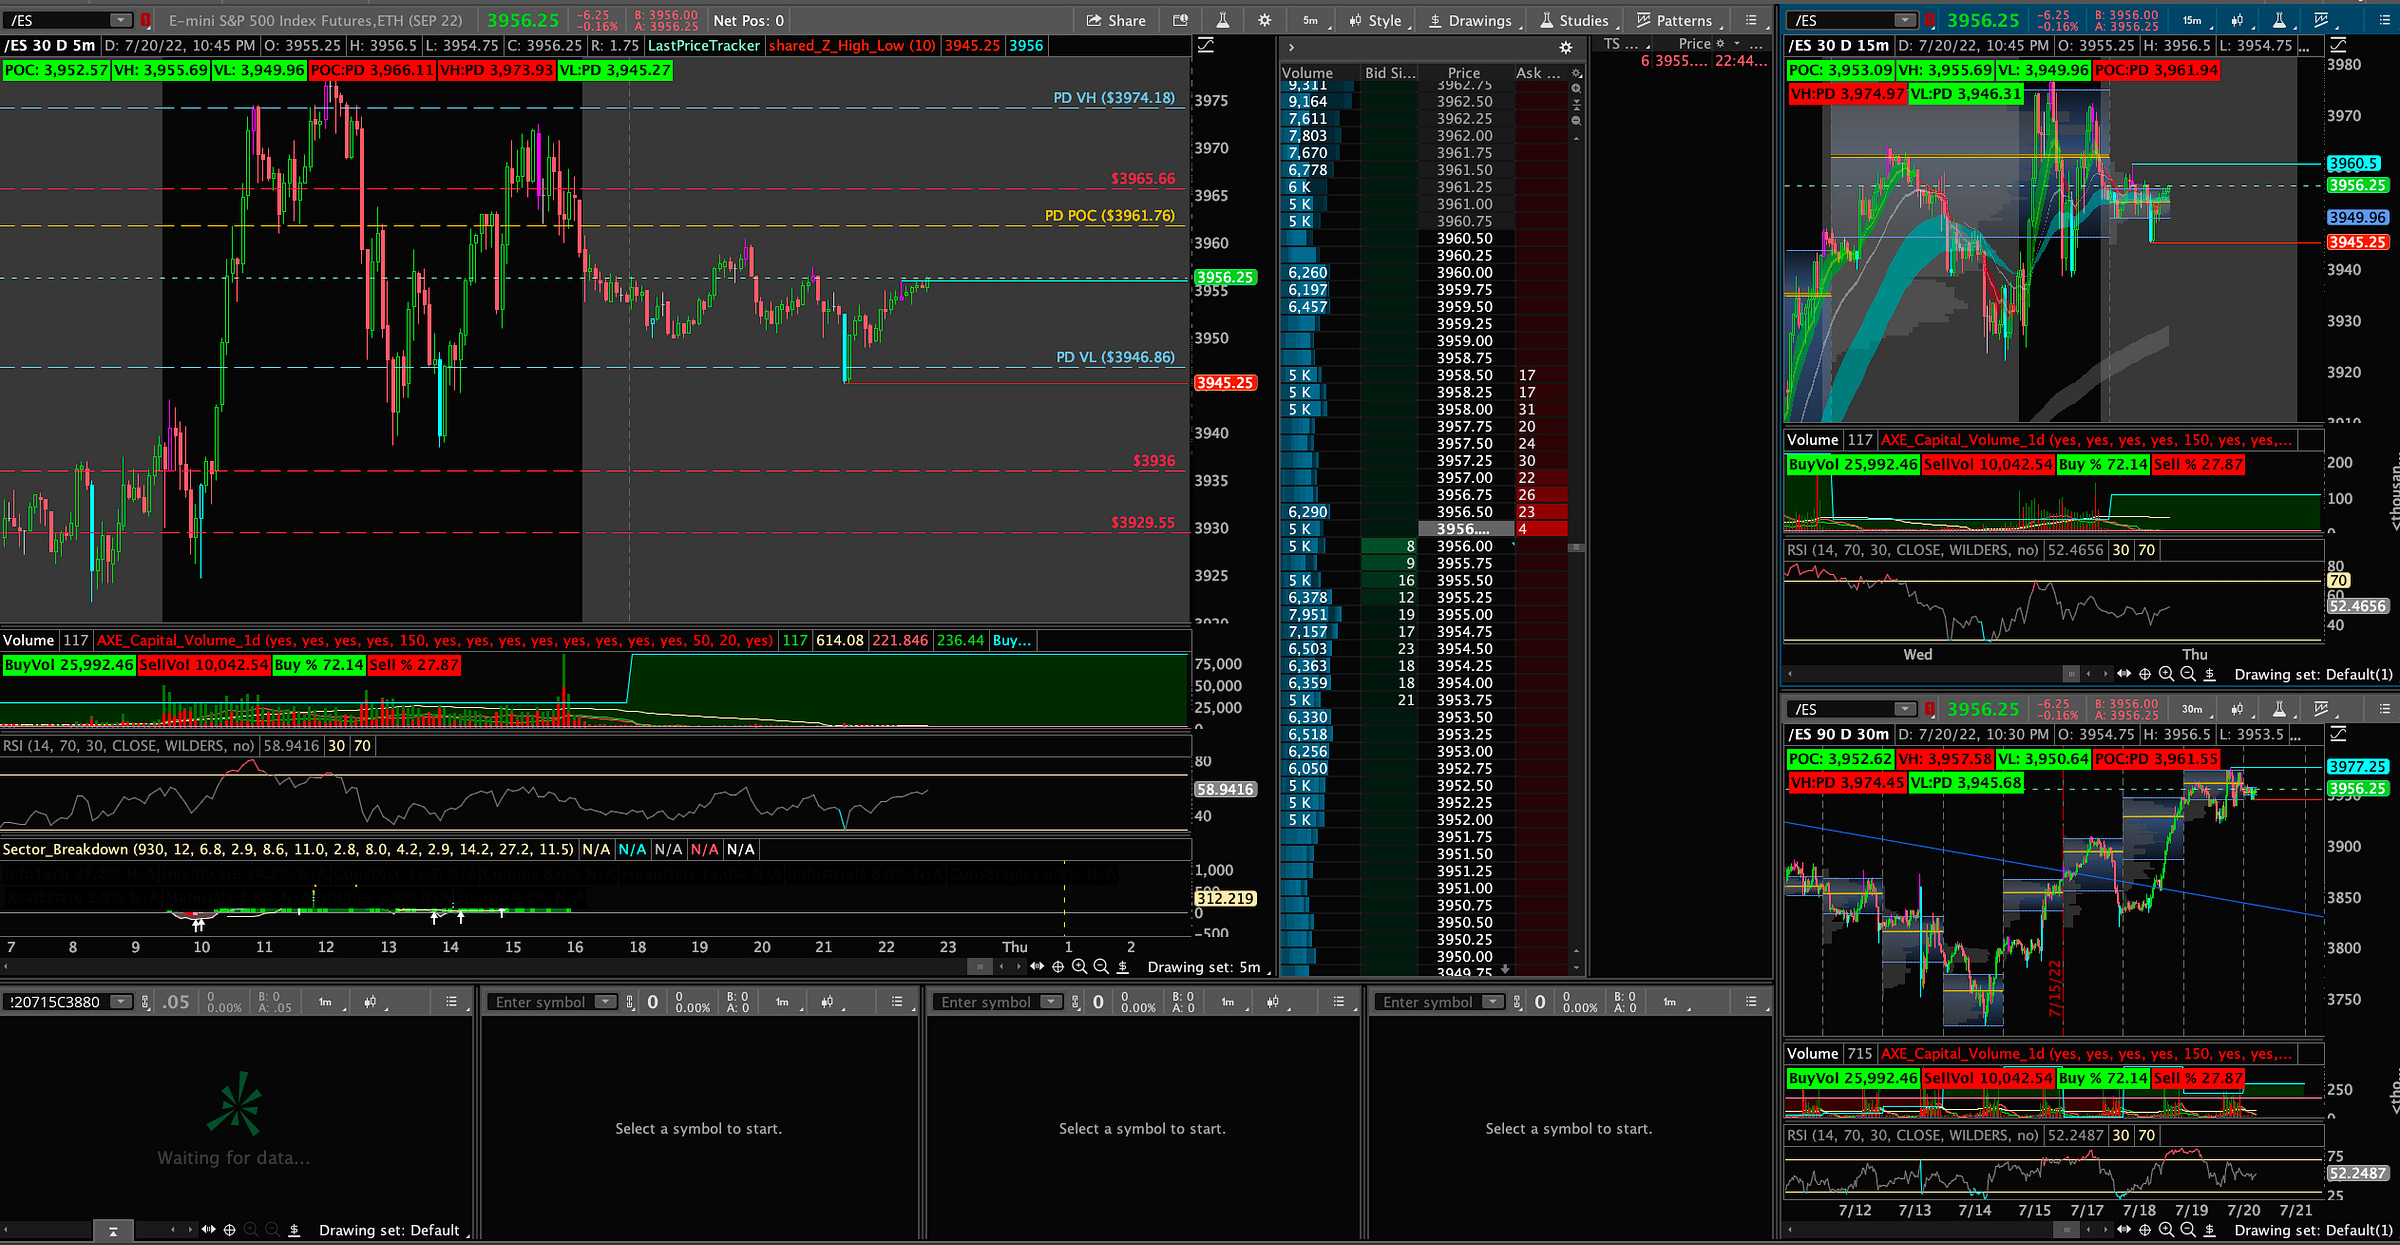
Intraday layout - 5min chart for while I am watching the Depth of Market and also have a 15min and 30min chart to watch as well. At the bottom you can put your Contacts you are watching for options! Just right click on any contract under “trade tab” and paste it where you would type the symbol.
- http://tos.mx/TlnpDNd
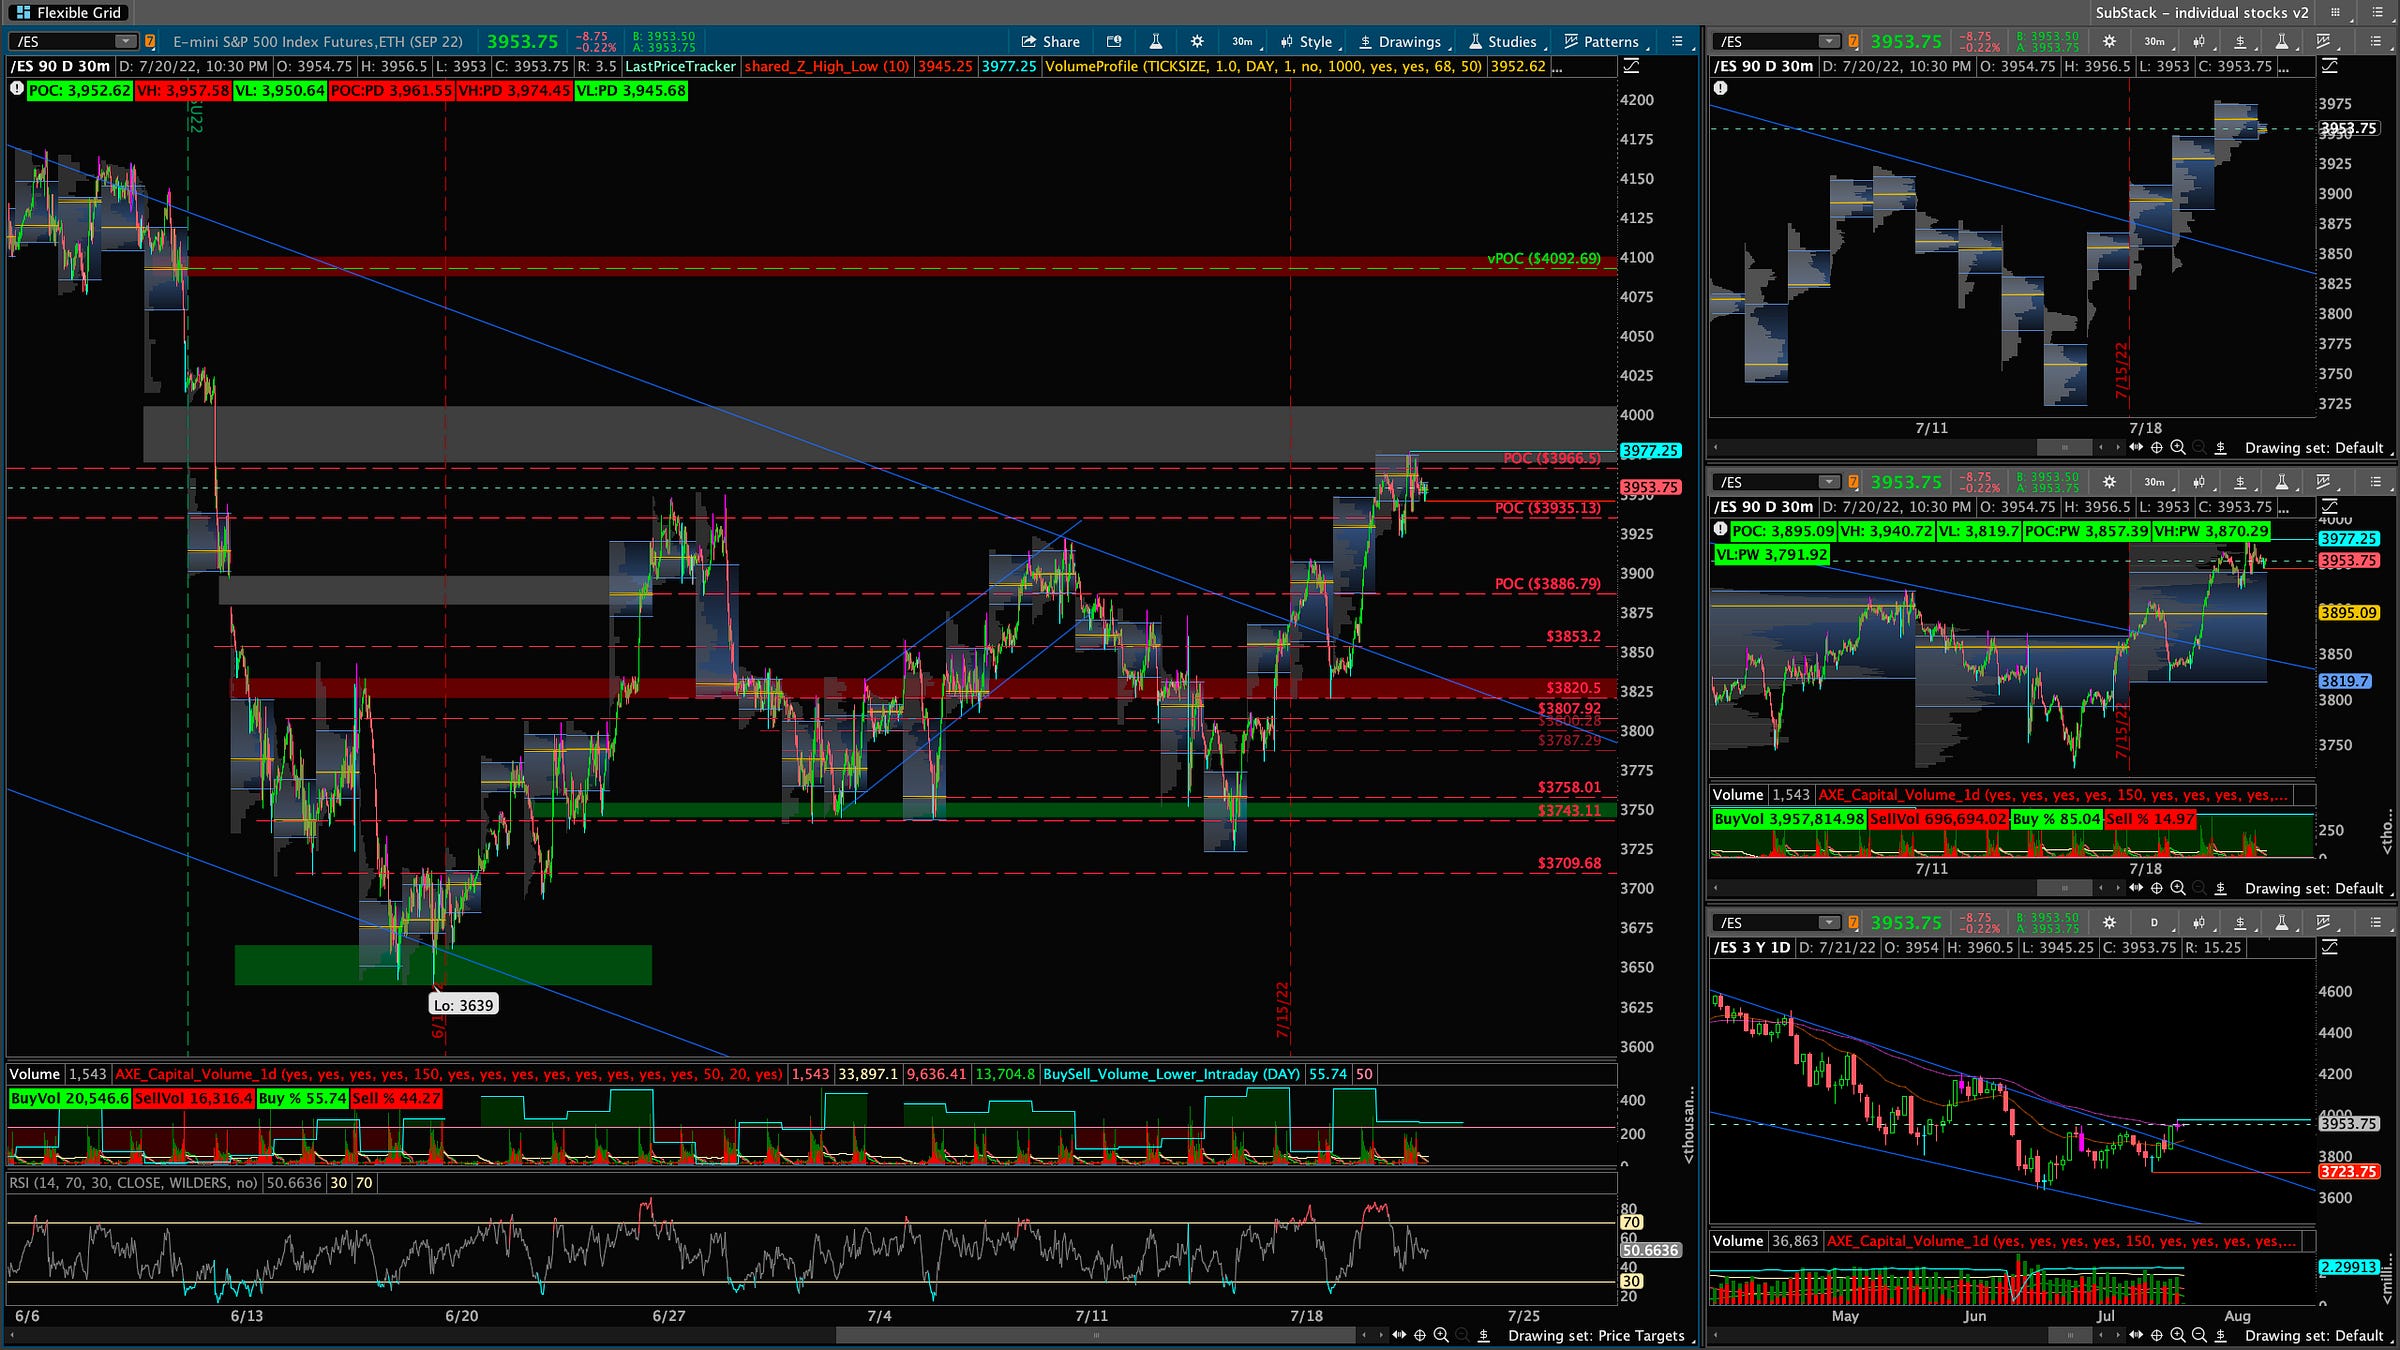
Post market review - 30min chart for charting all levels and then a daily and weekly profile chart! I ONLY CHART MY levels on this grid layout and 30min timeframe only!
- http://tos.mx/ENz3x0R
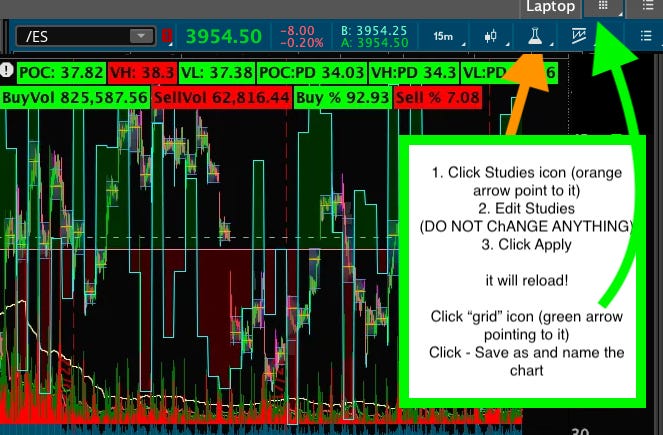
IMPORT Layout FIX - Like Below!
If it shows the VOLUME Lower Intraday Study on the chat - it SHOULD NOT
DO THE FOLLOW TO FIX IT!:
THEN MAKE SURE TO SAVE Flexible Grid and layout!
FREE Weekly Plan with 12+ Stocks - Premium DAILY Plan with 12+ stocks with Levels/charts + Focus Group Live Streams and more! TEXT ALERTS Coming Soon!
10. ABOUT ME:
For new traders, I recommend taking it very slow. When you do options especially pick 2-3 days out or a week. Key is to buy yourself time. 0DTE (day till expiration is when the contract ends the same day) you will get premium killed (value of your contract)
Also, another thing is when you play off someone's buy and sell signals it doesn’t teach you anything. It is an alert from someone who gives you confidence in a trade and if it doesn’t work out the person will get upset about the alert. Also with the alert, if I was posting buy and sell by the time I buy it will be a different price than what you or someone else may pay, if it goes the wrong way and I said “sell” you will then panic to sell where I could have been wrong and it runs or you are dumping for a loss with all the others.
When learning to trade you must understand the WHY
- Why should I take this trade
- Where will I cut it if it doesn’t work out? 5% or X level
- Where do I scale out? Price target 1 x 2 here and 3 so n - most if they see green keep holding till the trade goes red, then keep holding till it goes to 0 cuz they are in denial and hope it goes back up.
- You can’t trade off emotions and following people alerts.
What if they shut their alert service down you learned nothing and won’t know how to trade and just find another alert service to pay for to chat slap their alerts? A bad cycle of following alerts will never work out.
I believe in education and teaching people to fish for a lifetime not providing them with a fish for a day.
Once you grasp the basics, take 1 contract start with 1 contract and take it very slow this is not a get-rich game trading, it takes discipline and patience. Some days I don’t trade if I don’t like the chop or in between my levels. I wait for my levels to hit and then take a position based on if we broke through a level to the upside then pulled back and backtested it and it held. If it was rejected I would play the downside.
I also have a Daily Game Plan Posted EVERY NIGHT that goes over the following stock plus 3 BONUS STOCKS that the members pick. Any other requests I chart out and post in the group chat!
- FUTURES - /ES & /NQ
- ETFs - QQQ (tech) & IWM (small caps)
- VIX - Volatility Index
- TECH STOCKS - AAPL / MSFT
- CHIP STOCKS - AMD / NVDA
- BIG 3 - TSLA / AMZN / GOOGL
If you want to get the DAILY Game plan click “SUBSCRIBE NOW” below!
Join the Discord FREE Live Streams and Daily SPY Alerts! - To Join Just Click Here

