Hello fellow traders!
This is part 2 of the Education series where I want to go over Daily vs Weekly Volume Profile!
Many of you are accustomed to the 30 minute chart using the daily Volume Profile indicator but I want you to expand your horizons.
For those that have NOT YET read and understand what volume profile is, please read Part 1. What is Volume Profile ?
If you have read what Volume Profile is, awesome we can get to business as this won't be a very long post.
3 Part Guide
- Setting Up Your Chart
- Difference Between Weekly vs Daily
- Should I Use Both?
- 3 Example & 1 Example Where It May Not
Before We Get Started! If you enjoy this short read please share it with others!
I post a free weekly game plan that you can read here as well as my Daily VIP Blog which is for paid supporters!
I will be hosting a Live Stream Sunday 8pm EST that is FREE for Everyone In Discord goes over the basics of Volume Profile!
Link for the Discord is in the Weekly Game Plan!

Part 1 - Setting up your chart for Weekly Volume Profile
To setup your chart it is very similar to how we have it setup before as you are going to change only one setting.
- In ThinkorSwim click "studies"
- Click "Edit Studies"
- Click on the "Gear" icon
- Change "TIME PER PROFILE" from "DAY" to WEEK"
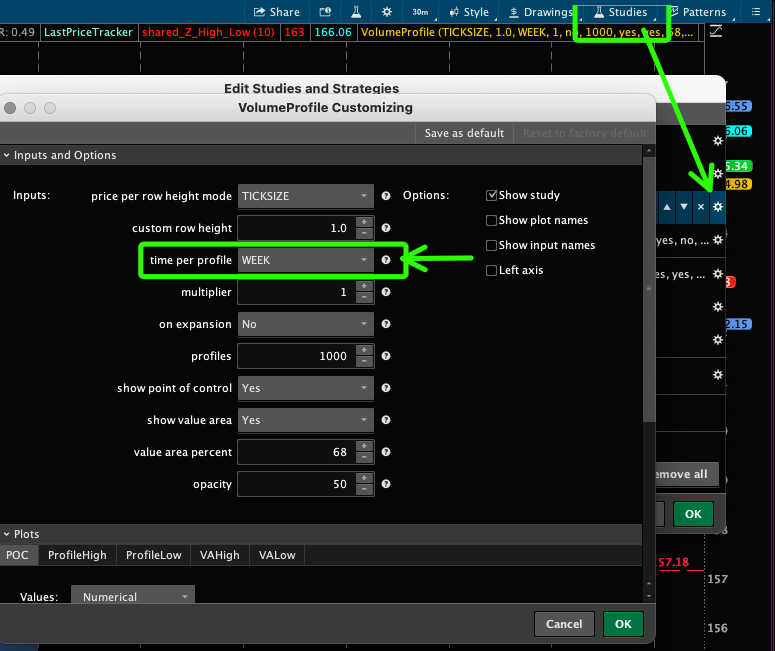
Once you do that your chart should look like mine below.
Part 2 - The Difference Between Daily & Weekly Volume Profile
First off the main obvious difference is the Daily is only 1 day 1 profile. Weekly is 7 days worth of data in 1 profile. Now let's read below as to why I use this to check my levels on as well and how to incorporate it into your trade plan!
Part 3 - Why Do I Use Weekly Profile? Should I Use Both?
So I personally use weekly profiles to see the big picture. It reduces a lot of the noise you will see on the daily volume profile charts. From there if I see some key levels of support or resistance I will mark them off. I ALWAYS then check my daily volume profile in addition and compare and contrast the levels. I will add necessary levels from the Daily Volume Profile!
It is overall just another perspective to look at things! It doesn't hurt to look at the weekly as well as the daily!
Part 4 - 3 Examples - 1 Instance Where It May Not Work 100%
We will go through a few examples!
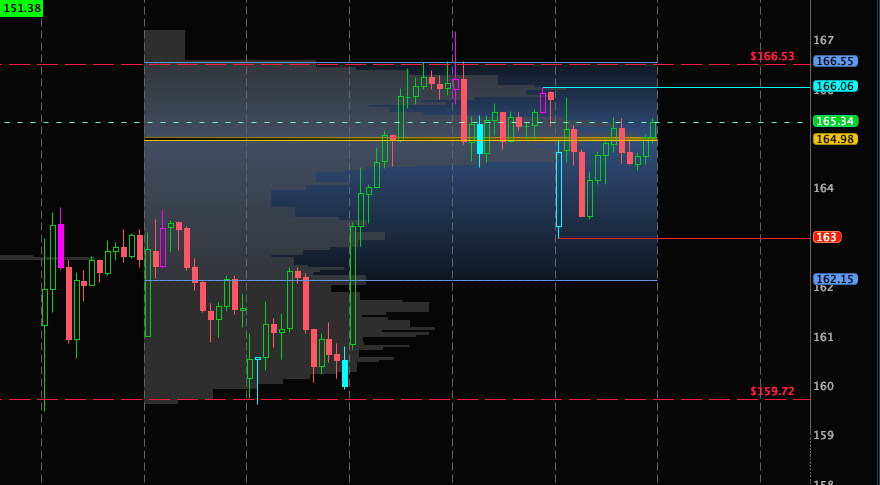
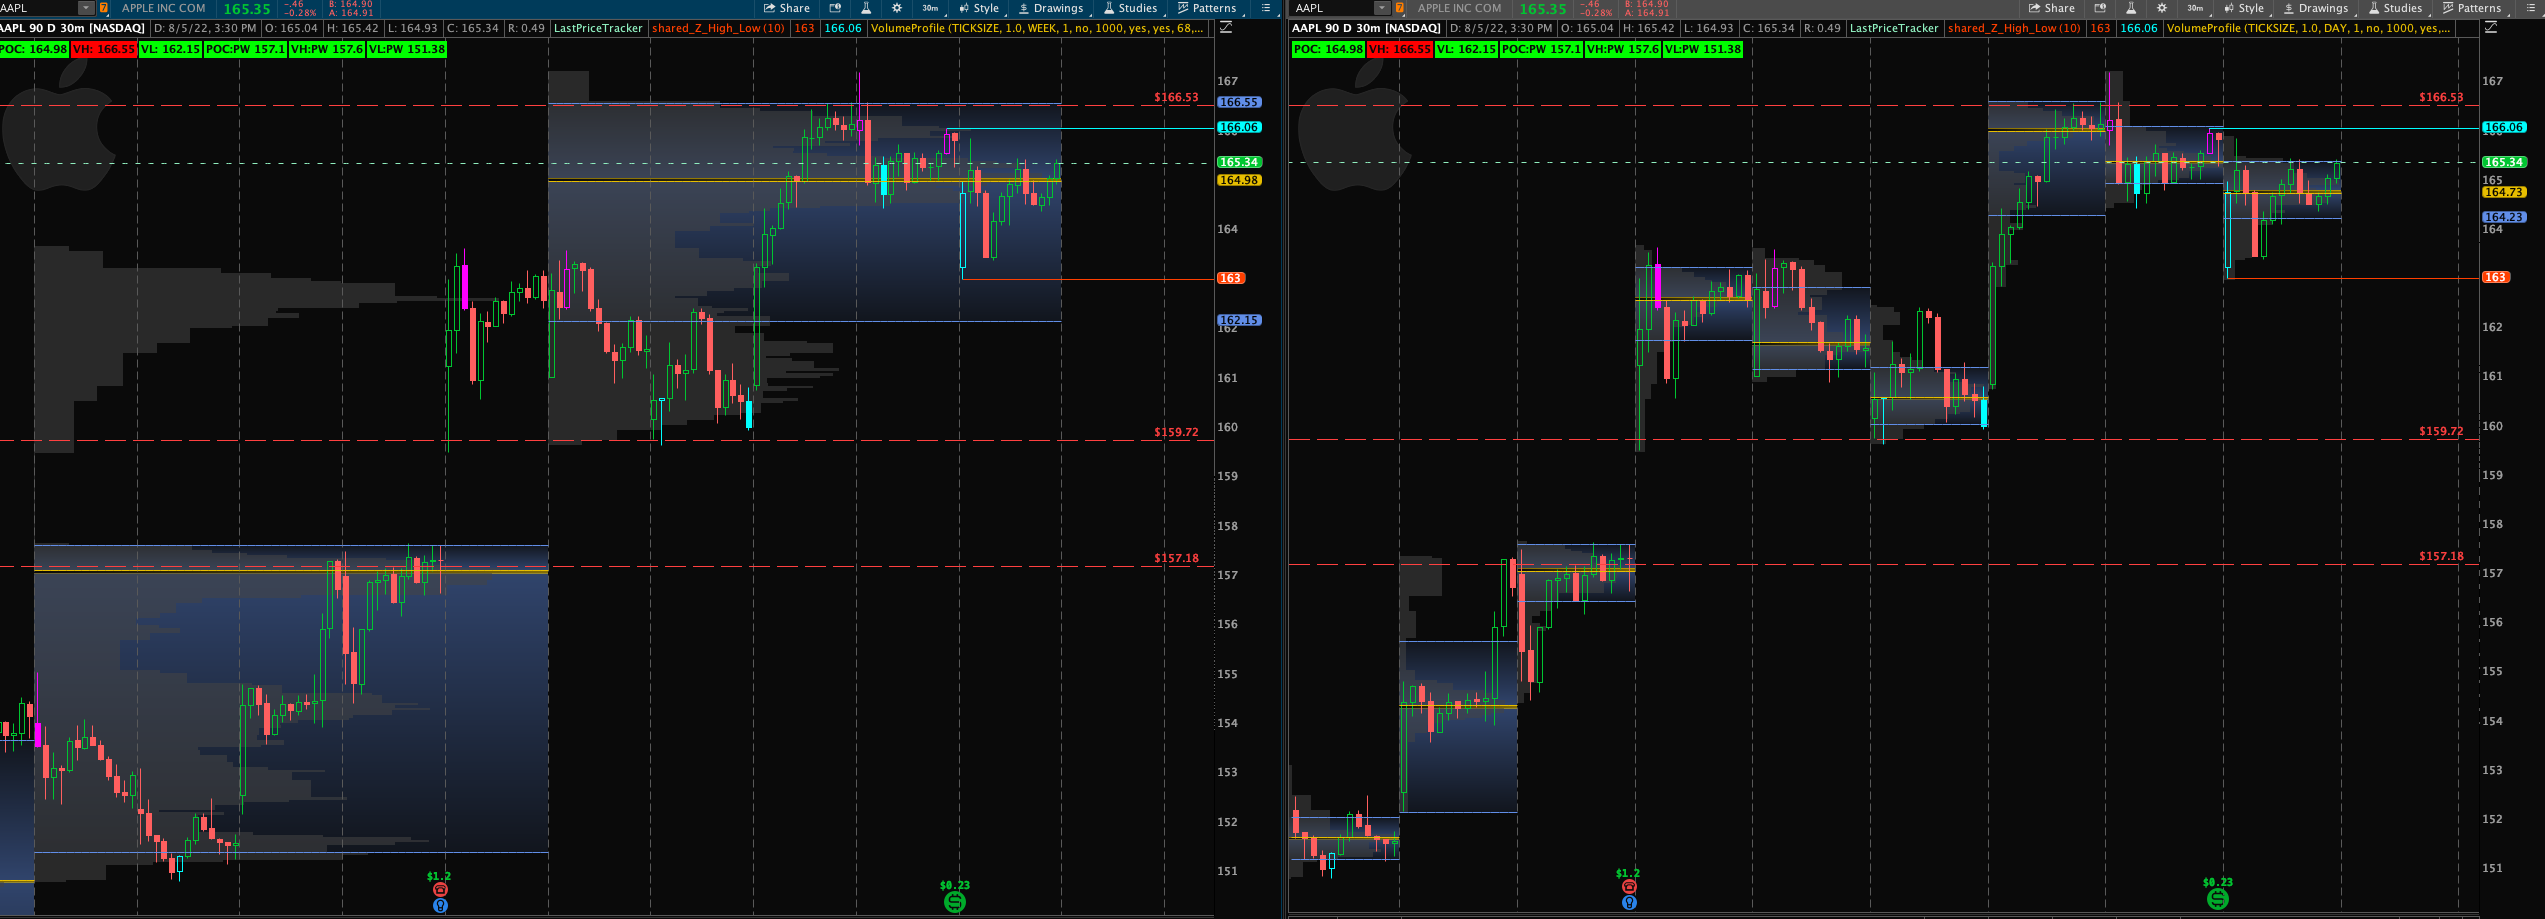
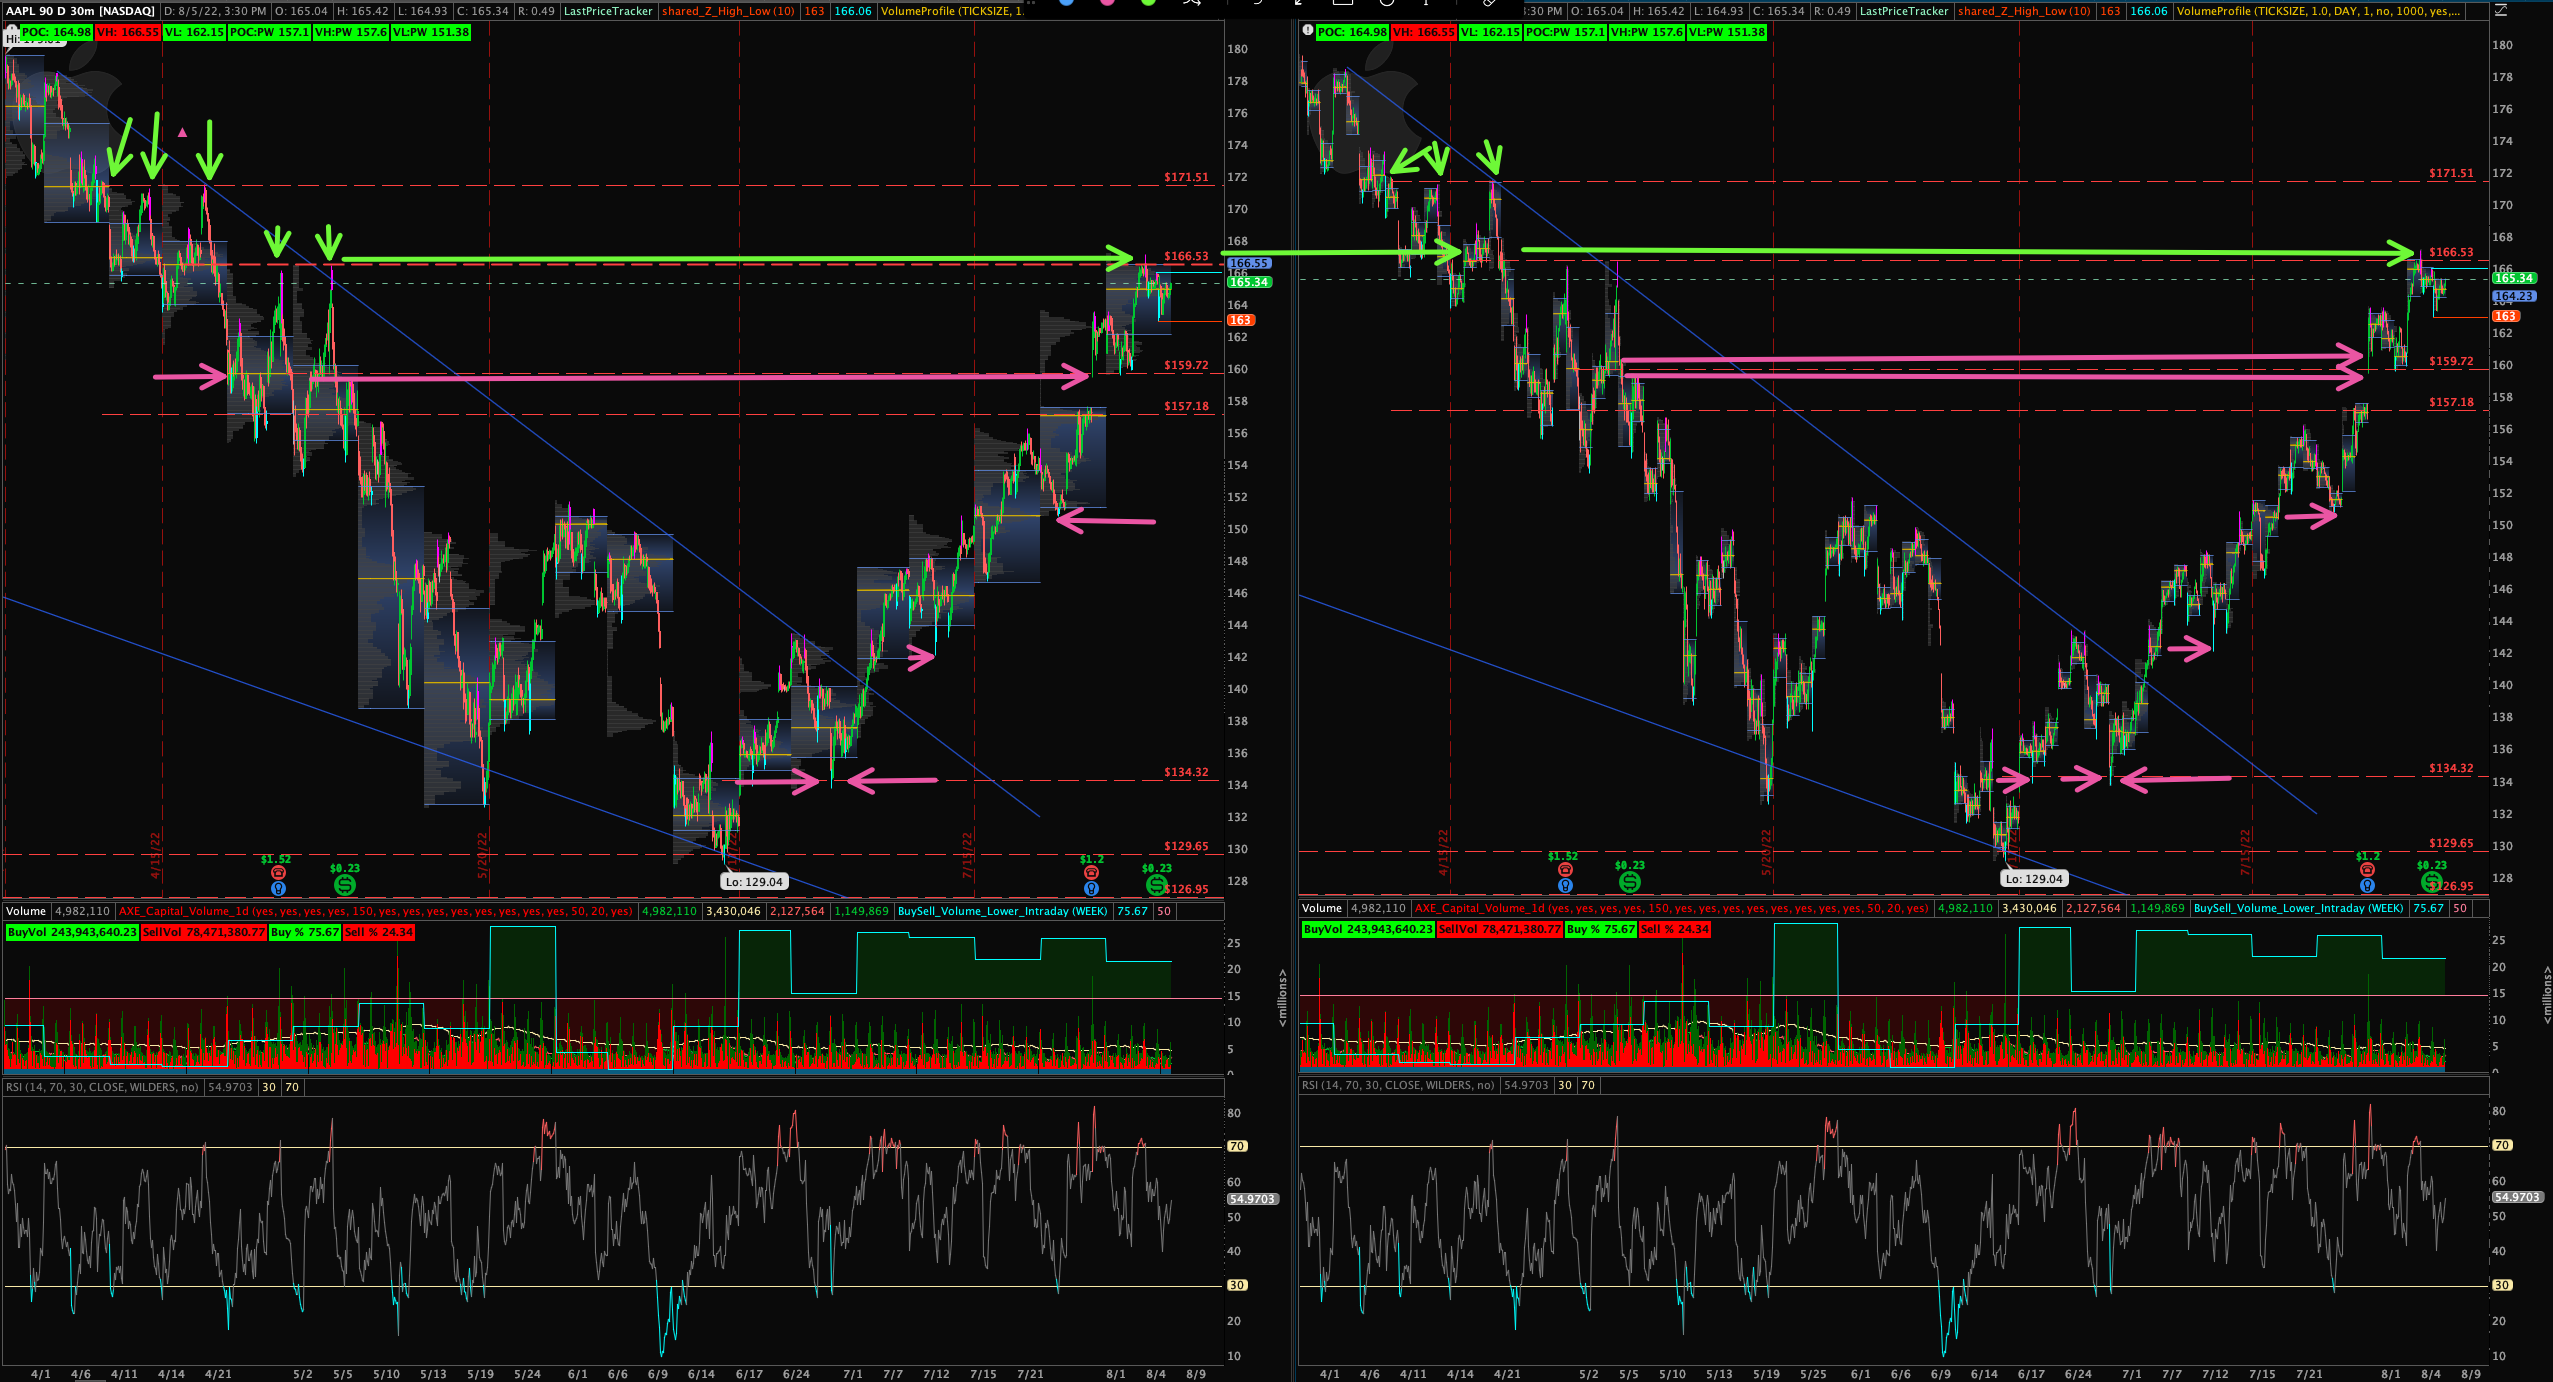
$AAPL - Week of 8/1 I called for people to watch very closely 166.53. 166.53 was a Weekly POC (point of control) from the week of 4/18. Looking at the daily on the right hand side that was also the POC on 4/19 but since it was tested you might have removed it.
However, on the weekly chart after the massive sell off you would of noticed it was retested that weekly POC 2 times and was a key zone to keep charted.
- Level 171.51 - A few more examples within the chart is the 171.51 level. This was close to a daily vPOC on the right hand side as well.
- Level 134 - Was another level that was a Weekly VH (left side) and a daily POC on the right hand side.
- Level 142 - Was a Weekly VL (left side) and a daily POC on the right side
Look at the chart below and analyze where my lines are as you will see on the right hand side how close if not some of the Daily POCs also are Weekly POCs
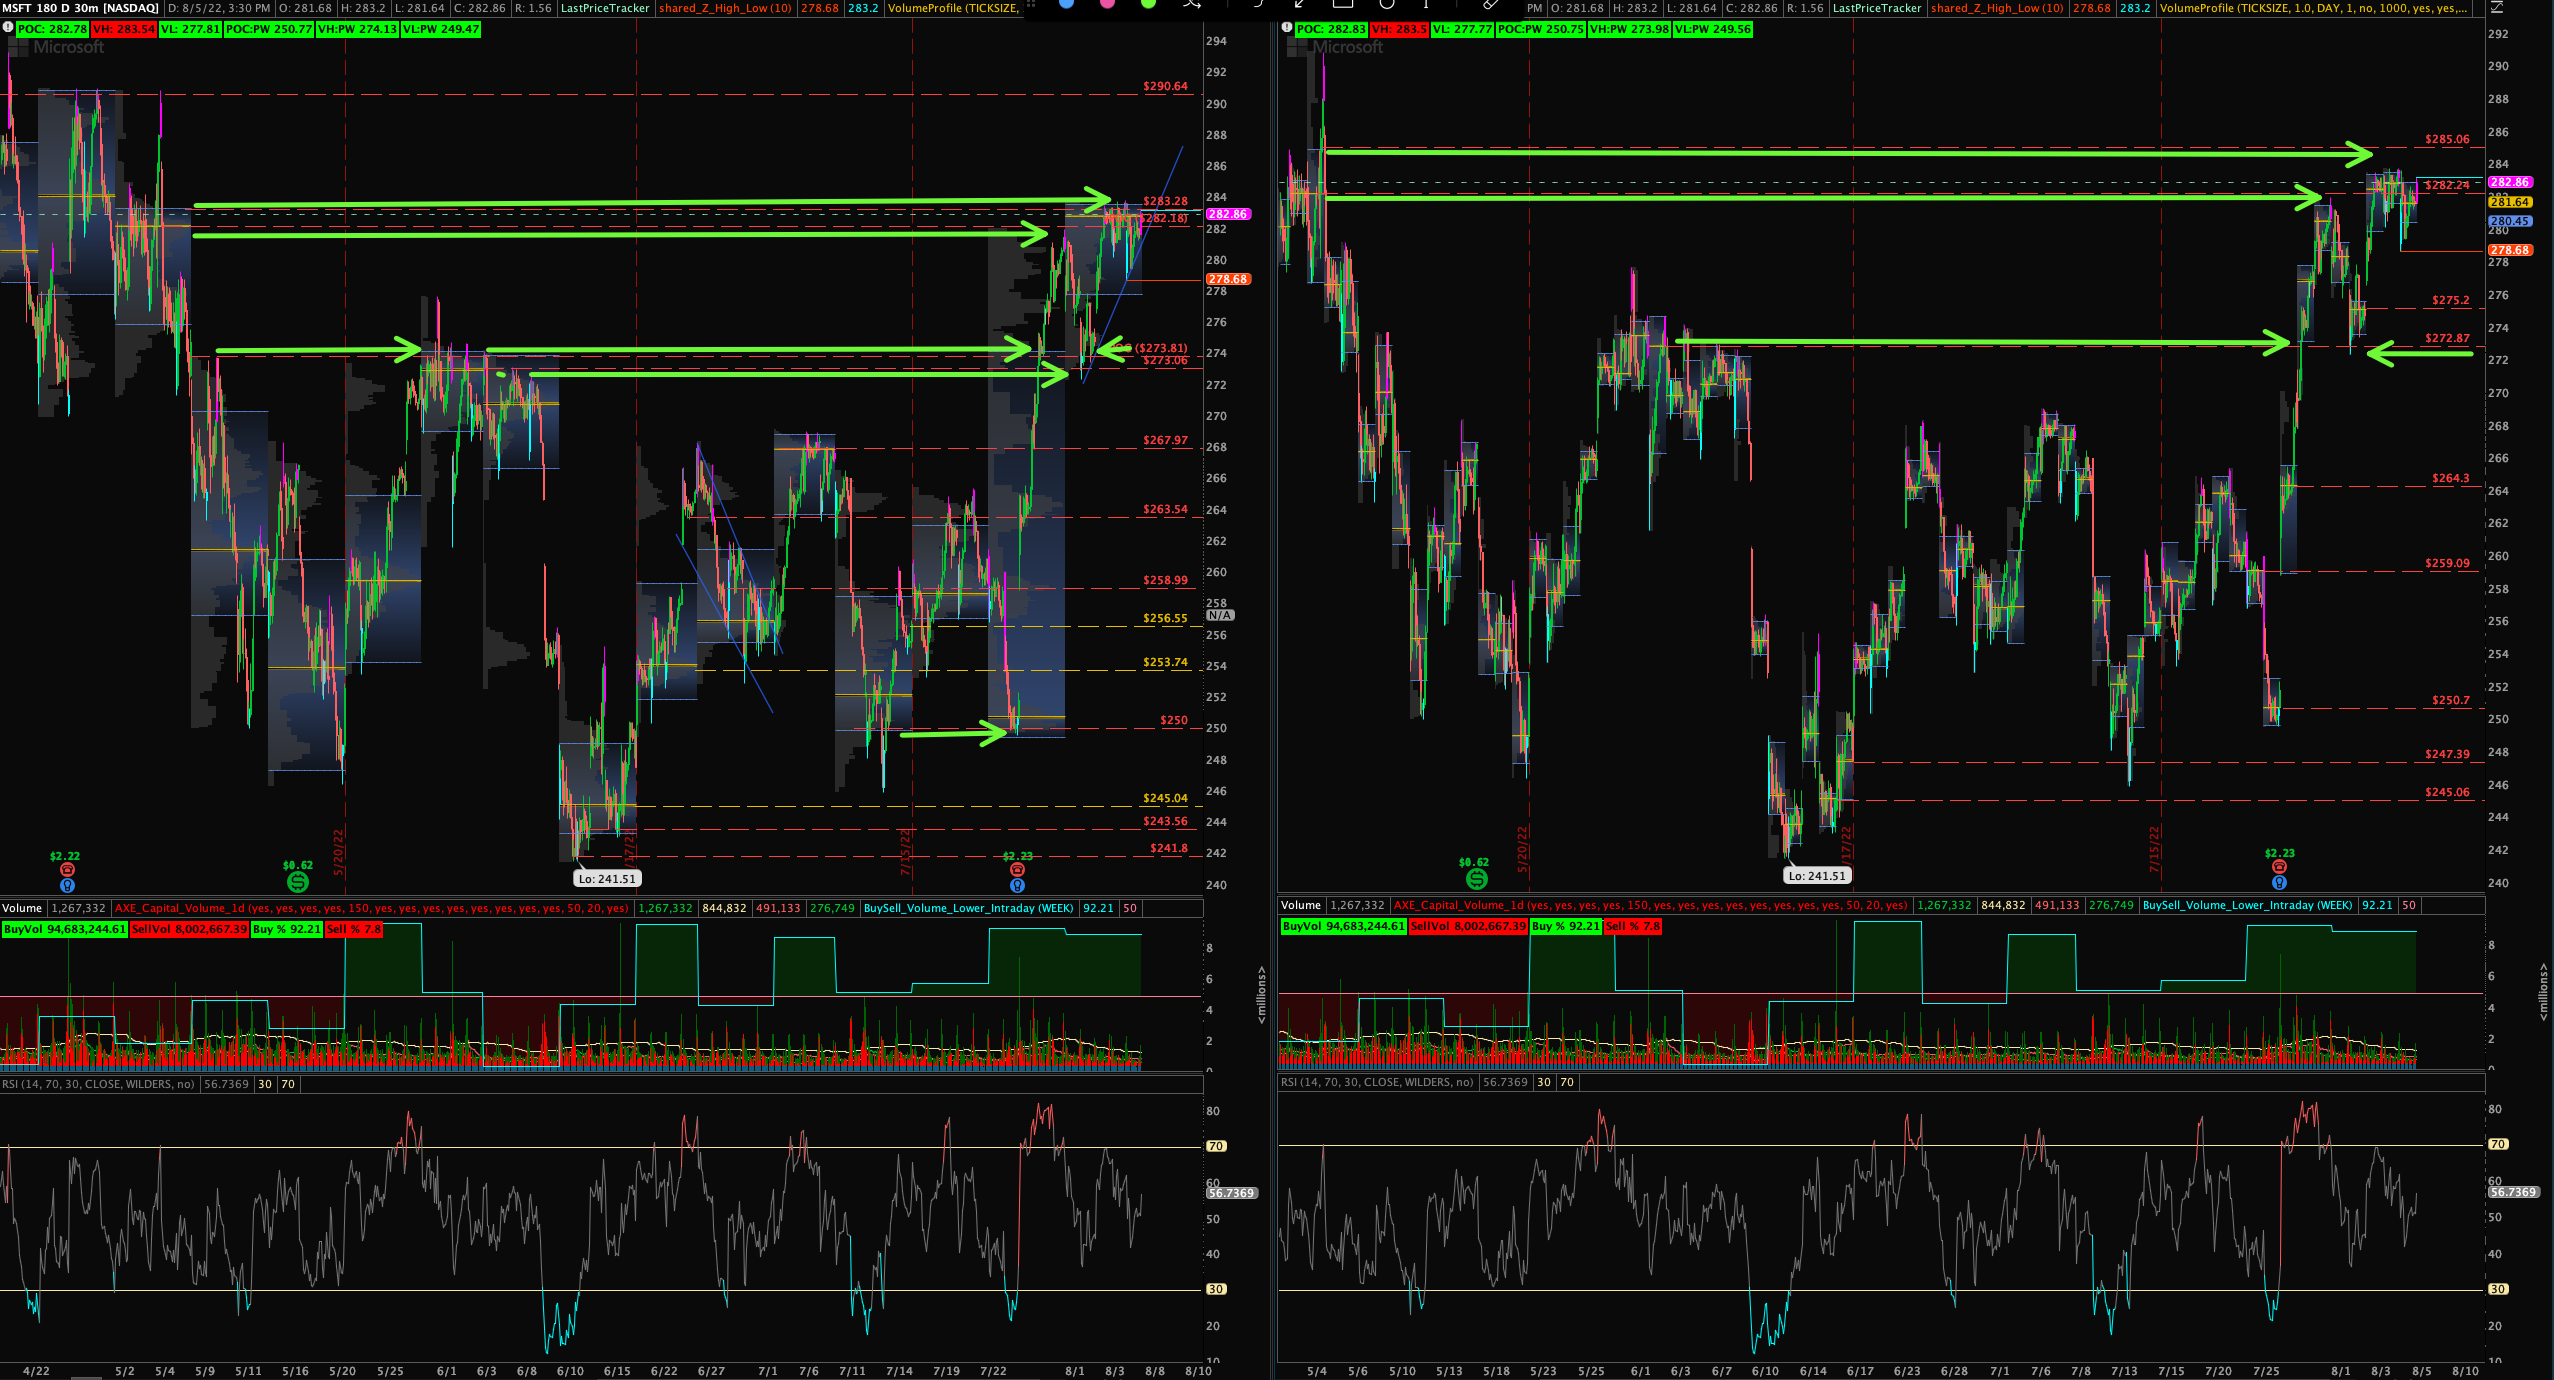
- Left Chart - Weekly Vol. Profile - 30 min time frame - Weekly Drawing Lines
- Right Chart - Daily Vol. Profile - 30 min time frame - Weekly Drawing Lines
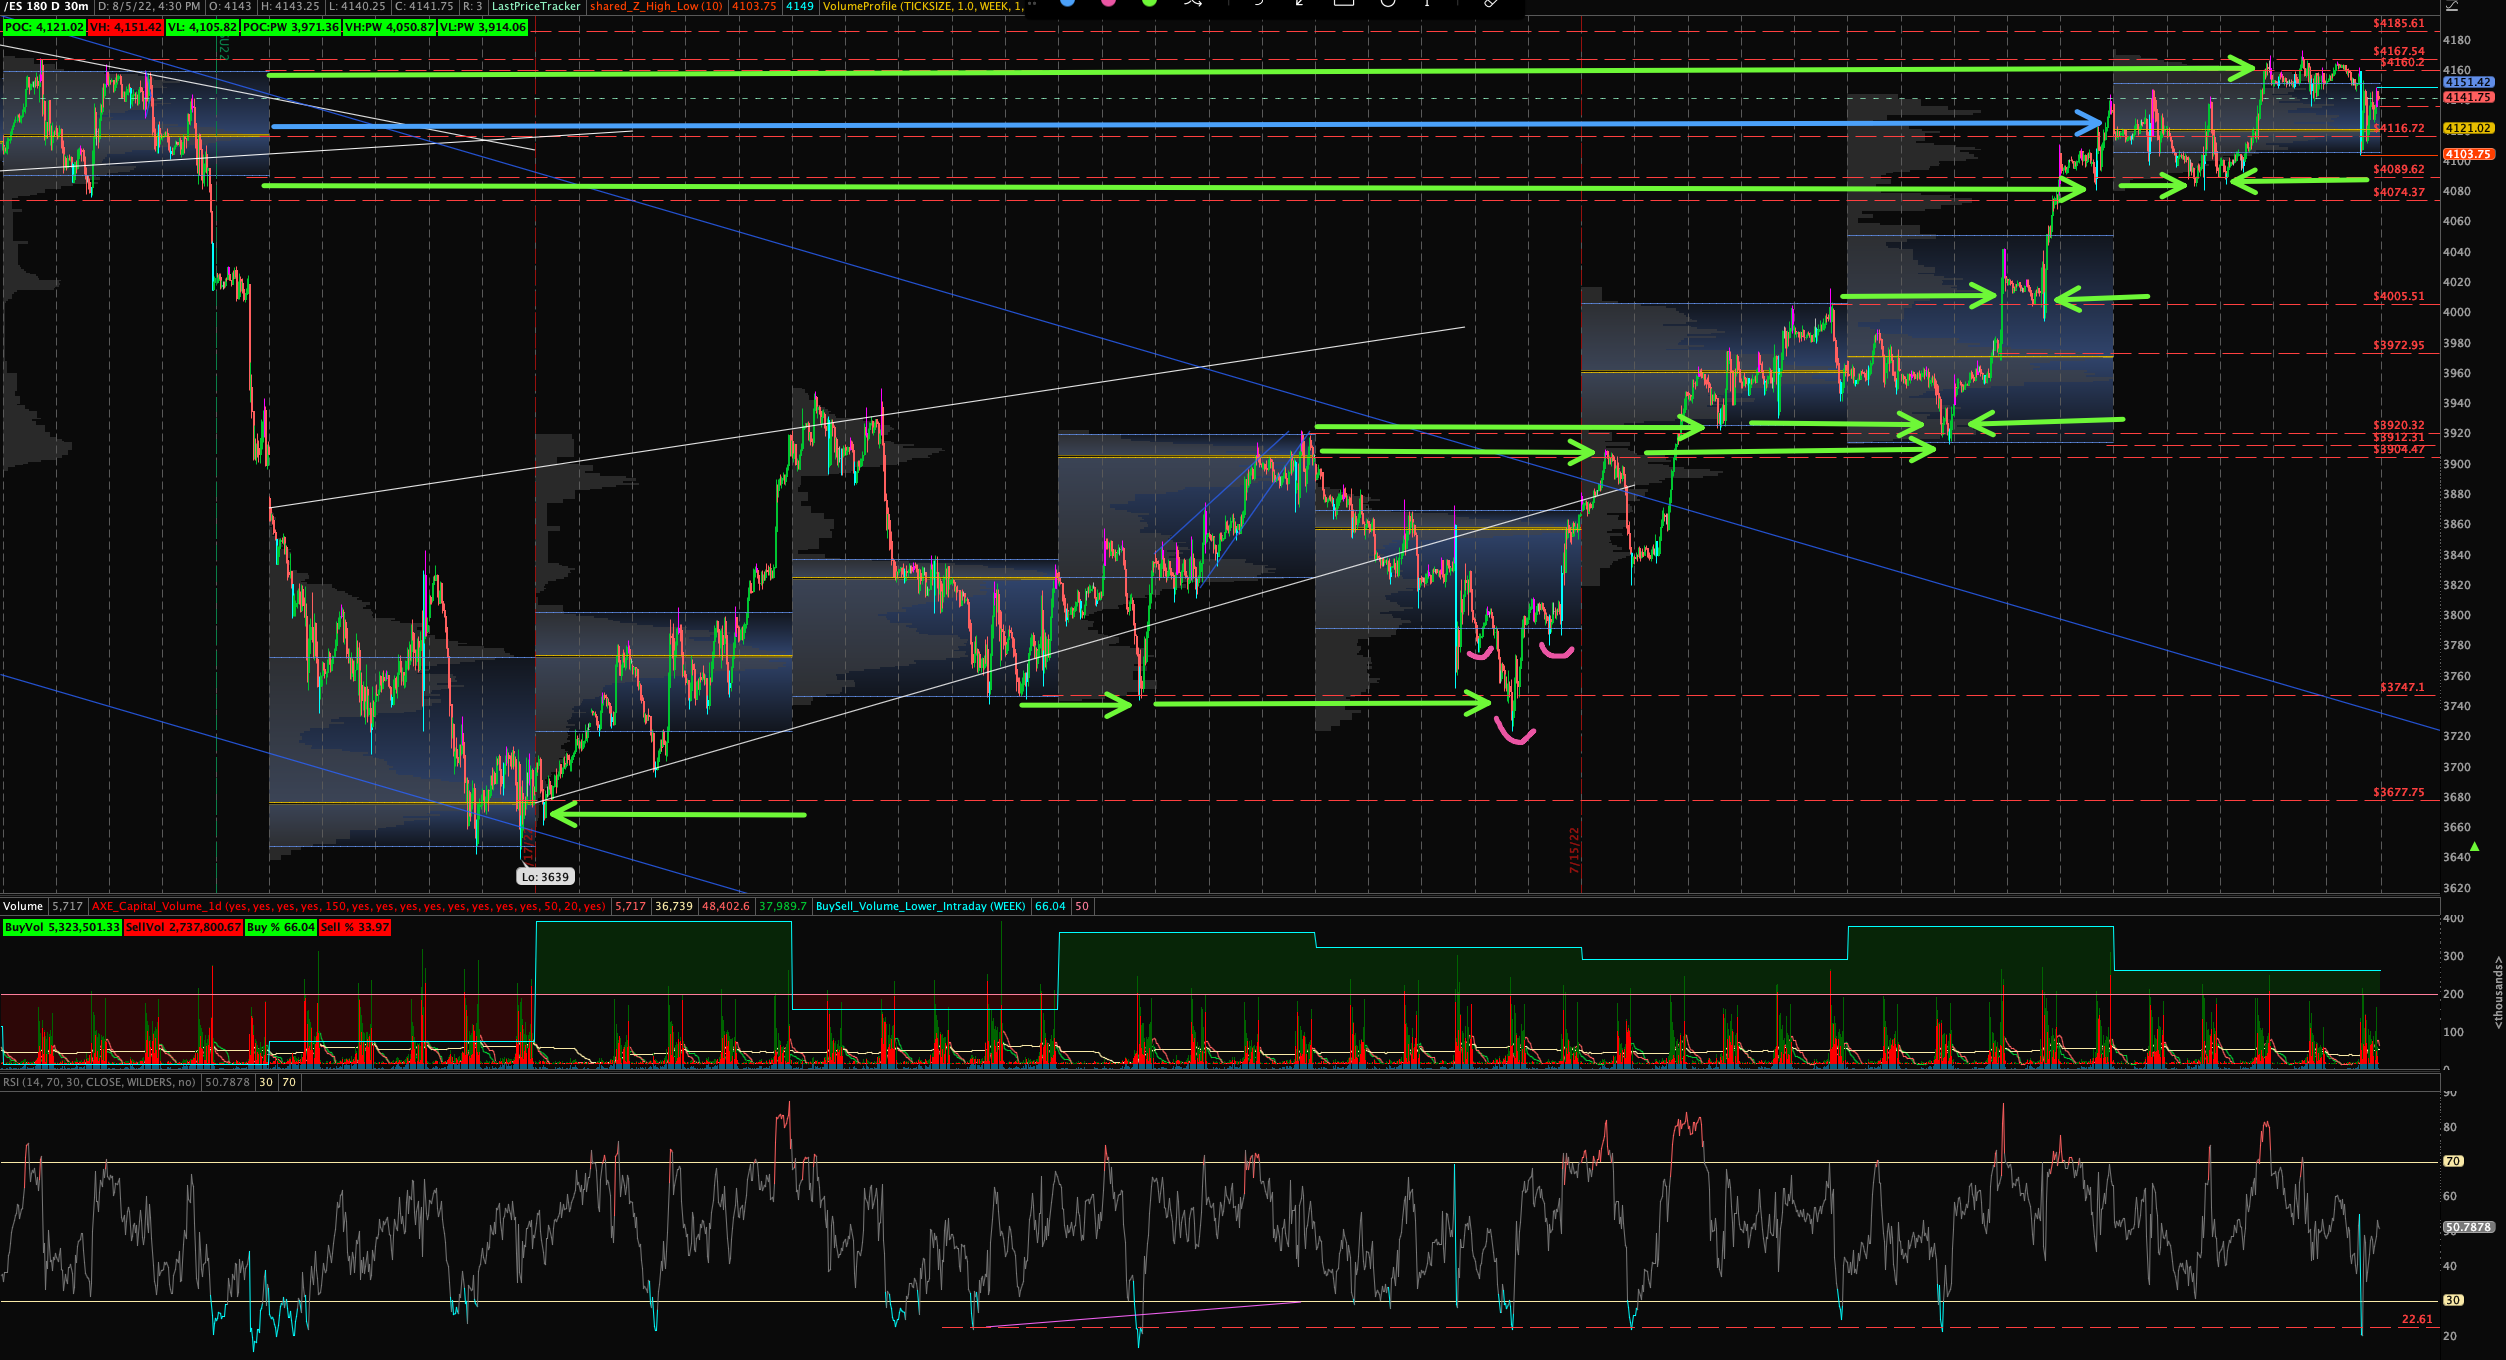
$ES_F /ES - This week was a tremendous week, the Week of 8/1 I called for people to note the 4160/4167 zone above as well as the bottom around 4089/4074 zone.
Why? Well look at 6/6 that week. We had a few overshoots of the VH and VL which is okay to note but if you look at the POC, VH and VL you would of not got chopped up this week. That week was a very choppy week in that zone so I antipacted if we re-entered that zone it could get choppy again and sure enough the weekly VH and VL provided the overall range for this week!
- Level 4160 VH - a weekly VH that provided resistance
- Level 4089 VL - a weekly VL that provided support
- Level 4005 - a Weekly VH that provided support (no full below that 4005 level)
- Level 3920 - a Weekly VH that provided support
- Level 3904 - a weekly POC that we rejected
- Level 3747 - a weekly VL that we bounced off of the 1st time on 7/5 then had a little bit of an overshoot on 7/14 but if you caught the left shoulder and then realized a possible inverse head and shoulder was forming you would of caught that bounce up for the beginning of the beautiful rally!
An Example Where It May NOT Work 100%
$MSFT - So MSFT is a good example of where it does work sometimes and when it doesn't.
- Level 283.28 VH - a weekly VH that provided resistance
- Level 282.18 POC - a weekly POC that provided resistance at first which was retested then broken. We chopped around then.
- Level 273.81 VH - a weekly VH that provided support
- Level 273.06 POC - a weekly POC that provided resistance the first around then later provided support
- Level 263/258/253/250 - levels that got chopped around or didn't get fully tested